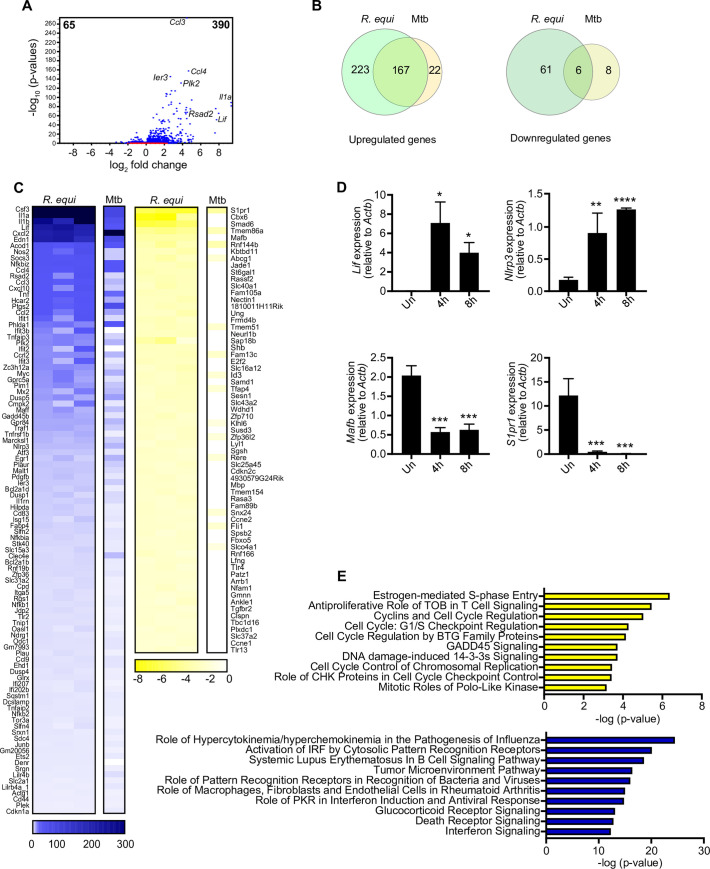
Fig 2. RNA-seq analysis reveals upregulation of pro-inflammatory cytokines and type I interferon response genes in R. equi-infected murine macrophages.
(A) Volcano plot showing gene expression analysis of RAW 264.7 macrophages infected with R. equi. x axis shows fold change of gene expression and y axis shows statistical significance. Downregulated genes are plotted on the left and upregulated genes are on the right. (B) Venn diagram comparing differentially expressed genes in RAW 264.7 genes during R. equi and Mtb infection. Upregulated genes are shown in the left Venn diagram and downregulated genes are shown in the right. (C) Heatmap showing gene expression analysis of RAW 264.7 macrophages infected for 4h with R. equi or Mtb compared to uninfected cells. Each column for R. equi represents a biological replicate. Mtb is shown as average of 3 replicates. Blue genes are upregulated in infected cells, yellow genes are downregulated in infected cells. (D) RT-qPCR validation of upregulated genes (Lif, Nlrp3) and downregulated genes (Mafb, S1pr1) in RAW 264.7 macrophages at 4 and 8h post infection with R. equi. (E) Ingenuity pathway analysis of gene expression changes in RAW 264.7 macrophages infected with R. equi. Downregulated genes are shown on top in yellow and upregulated genes are shown on the bottom in blue. (A-E) represent 3 biological replicates ± SD, n = 3. For RT-qPCRs, statistical significance was determined using Students’ t-test. *p < 0.05, **p < 0.01, ***p < 0.001, ****p < 0.0001, ns = not significant. For DGE statistical significance was determined using the EDGE test in CLC Genomics Workbench. Significant differentially expressed genes were those with a p <0.05 and fold change of <±2.

