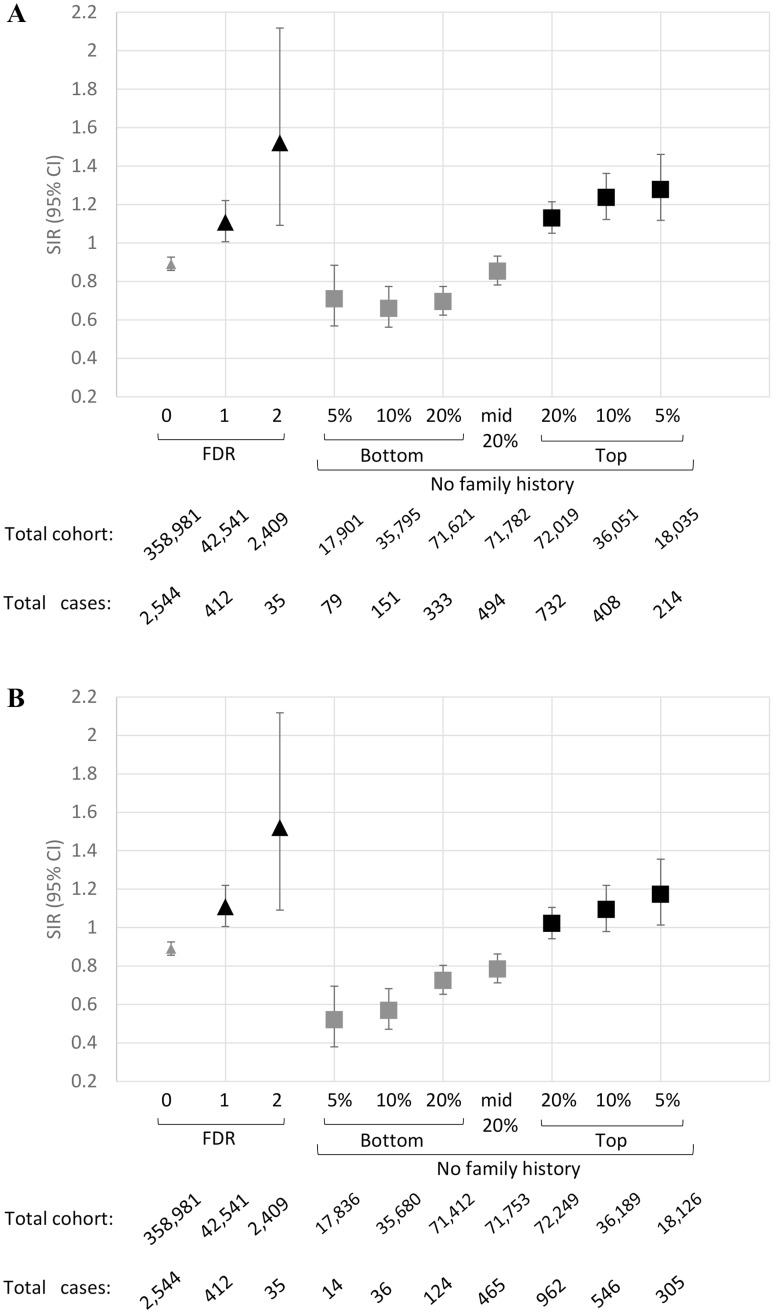
Fig 2. Comparison of the standardised incidence ratios (SIR) for different subgroups.
SIR values were generated based on number of cases observed and expected using sex-specific UK population incidences for the number of affected first-degree relatives (FDR) vs the combined model for people without a family history. SIR values were plotted against number of affected first-degree relatives in comparison with full lifetime (A) and 10-year (B) risk categories for participants without family history.

