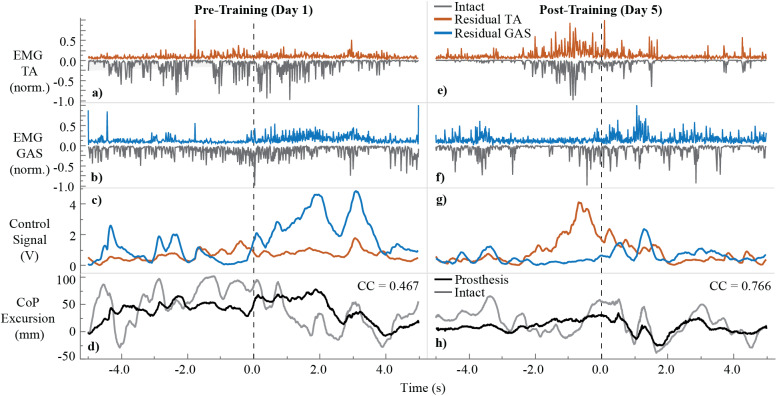
Figure 5.
Representative load transfer trials pre- and post-training. Dashed line: moment of peak deceleration during squatting movement. (a) Normalized electromyography (EMG) of residual (orange) and intact (gray) tibialis anterior (TA) muscle pair. (b) Normalized EMG of residual (blue) and intact (gray) gastrocnemius (GAS) muscle pair. (c) Control signal to the prosthesis from the real-time processing of residual TA (orange) and residual GAS (blue) muscle EMG. (d) Center of pressure (CoP) excursion from prosthetic (black) and intact foot (gray). Cross-correlation values are displayed for each representative trial (pre: cross-correlation[CC] = .467, post: CC = .766). (e–h) Data for post-training. Normalized EMG was calculated by dividing the maximum EMG value for each muscle from the entire trial.

