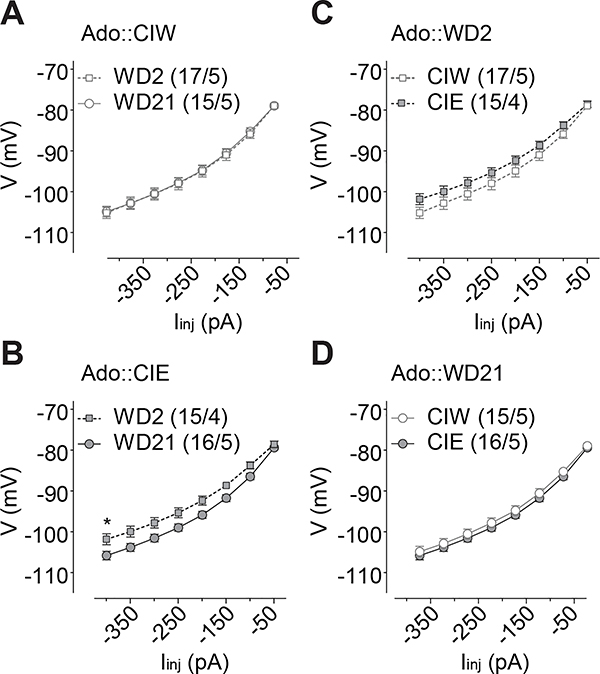
Figure 6. Injection current-dependent differences of the membrane change observed on WD2 in rats with a history of Ado::CIE.
A, B, Summarized data showing that, although no significant difference of the I-V input-out response curves between WD2 vs. WD21 in Ado::CIW rats (A), significantly different I-V input-output response curves between WD2 vs. WD21 were observed in Ado::CIE rats (B). C, D, Summarized data showing significant differences of the I-V input-out response curves between in rats treated by Ado::CIW vs. Ado::CIE on WD2 (C) but not WD21 (D). Except in cases with other statistics as specified in the RESULTS, data were analyzed by two-way ANOVA with repeated measures, followed by Bonferroni post-hoc tests. n/m, the number of cells/animals for data collection. *, p<0.05.

