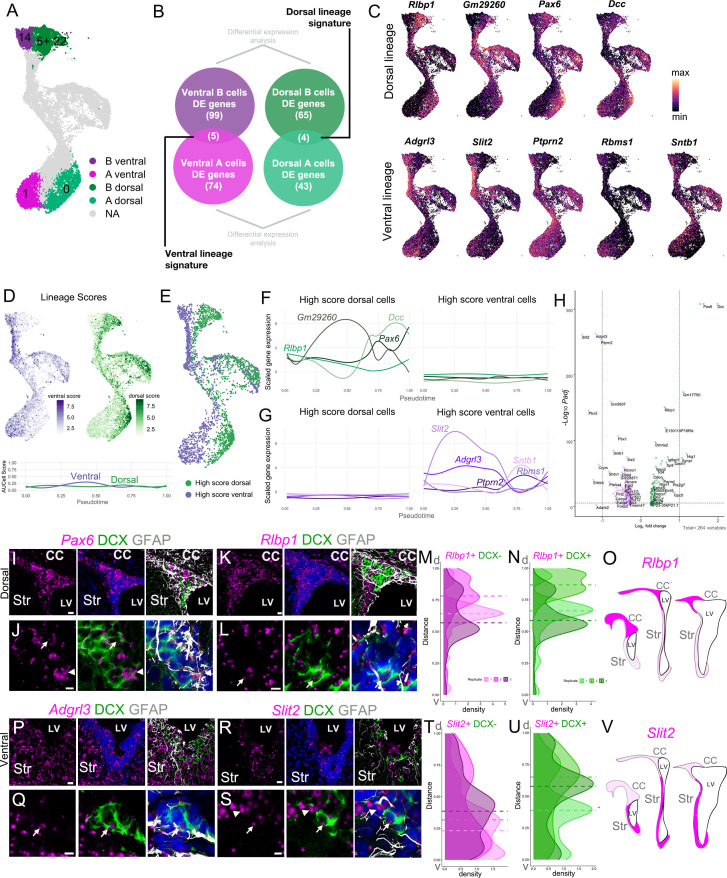
Figure 6. Regional transcriptional signatures are maintained along the neurogenic lineage.
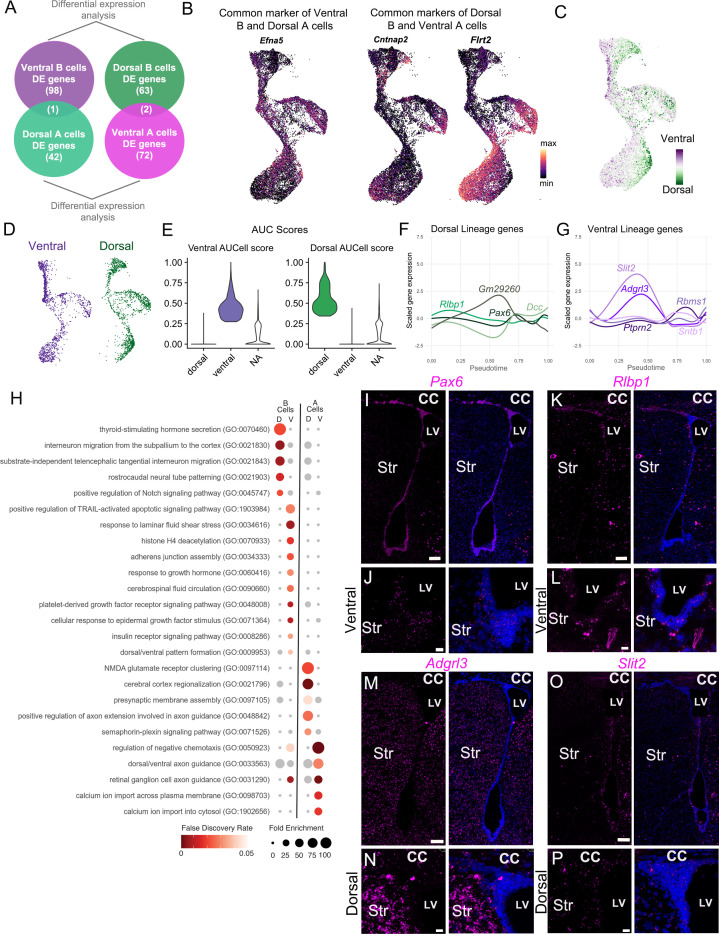
(A) UMAP plot highlighting the putative dorsal and ventral B and A cell clusters. (B) Schematic illustrating the approach to identify genes that are differentially enriched in dorsal B and A, and ventral B and A cells, comparing B(14) to A(1) and B(5) and B(22) to A(0). (C) Expression patterns of dorsal (top row) and ventral markers (bottom row) identified as differentially enriched throughout the B-C-A lineage. (D) Cell scores based on the combined expression of genes in the ventral lineage signature (ventral score; purple) and genes in the dorsal lineage signature (dorsal score; green) throughout the neurogenic lineage. Lineage scores, as the combined expression of genes of the dorsal and ventral signatures, remain relatively constant throughout all cells along the neurogenic lineage. (E) High Score (top quartile of each lineage score) dorsal (green) and ventral (purple) cells in the neurogenic lineage. (F) Expression of dorsal signature genes in High Score dorsal (left) and High Score ventral cells (right) along the neurogenic lineage progression, assessed by pseudotime (see also Figure 6—figure supplement 1). (G) Expression of ventral signature genes in High Score dorsal (left) and High Score ventral cells (right) along the neurogenic lineage progression, assessed by pseudotime. (H) Volcano plot of significantly differentially expressed genes between High Score dorsal and High Score ventral neurogenic lineages. (I - J) RNAscope validation of dorsal lineage marker Pax6 (magenta) with DCX (green) and GFAP (white) immunostaining. High-magnification images of the V-SVZ dorsal wedge (I). J. High-magnification image of the V-SVZ where Pax6 colocalizes with an A cell (arrow) and B cell (arrowhead) (see also Figure 6—figure supplement 1). (K- L) RNAscope validation of dorsal lineage marker Rlbp1 (magenta) in the dorsal wedge (K). L. High-magnification images of Rlbp1 in the dorsal V-SVZ, where puncta are visible in a DCX-positive A cell (arrow). (M-O) Quantifications of DAPI+,DCX- (M) or DAPI+,DCX+ (N) Rlbp1 RNAscope puncta along the length of the V-SVZ (0 = ventral-most extent, 1 = dorso-lateral-most extent of the wedge) with the median puncta distribution location plotted as a horizontal line for each sample (n=3, each indicated by a different shade, ~ bregma 1.34, 1.18, and 0.98 mm). (O) Summary schematic of Rlbp1 expression in three rostro-caudal coronal sections (~bregma 1.50, 0.98, and 0.14 mm); strong expression (magenta); sparse (light magenta). Note that Pax6 showed a similar distribution. (P-Q) RNAscope validation of ventral lineage marker Adgrl3 (magenta) in the ventral V-SVZ. (Q) High-magnification image of Adgrl3 in the ventral V-SVZ, colocalizing with an A cell (arrow). (R-S). RNAscope validation of ventral lineage marker Slit2 (magenta) in the ventral V-SVZ. S. High-magnification image of the ventral V-SVZ, where Slit2 puncta colocalize with an A cell (arrow) and B cell (arrowhead). (T-V). Quantifications of DAPI+,DCX- (T) or DAPI+,DCX+ (U) Slit2 RNAscope puncta along the length of the V-SVZ (0 = ventral-most extent, 1 = dorso-lateral-most extent of the wedge) with the median puncta distribution location plotted as a horizontal line for each sample (n=3, each indicated by a different shade, ~ bregma 1.34, 1.18, and 0.62 mm). V. Summary schematic of Slit2 expression in three rostro-caudal coronal sections (~bregma 1.50, 0.98, and 0.14 mm); strong expression (magenta); sparse (light magenta). Note that Adgrl3 showed a similar distribution. CC: corpus callosum, Str: striatum, LV: lateral ventricle. Scale bars: 15 μm (K, P, and R), 10 μm (I), and 5 μm (J, L, Q, and S).


