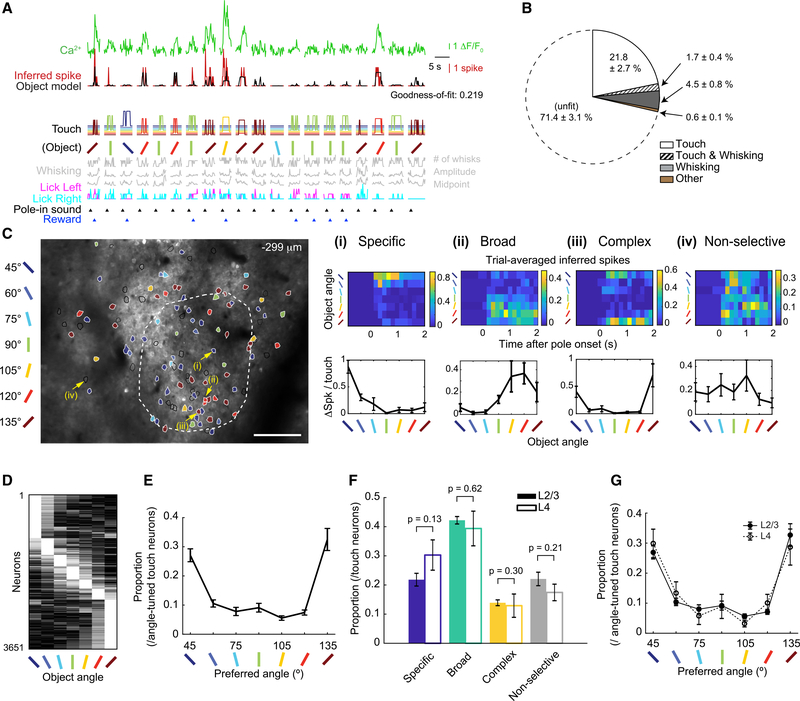
Figure 3. Angle-Tuned Touch-Responsive Excitatory Neurons Are Distributed across L2–4 Barrel Cortex of Naive Mice.
(A) Calcium and inferred spike traces of 20 consecutive trials. Object model fit to inferred spikes from below predictors. Temporal delays and total touch (STAR Methods, GLM for Neuronal Activity - ‘Object Model’) omitted for clarity.
(B) Average proportion of behavioral classes assigned to each neuron (n = 12 mice). “Other” represents licking, sound, and reward alone or in combination with touch or whisking.
(C) An example field-of-view (FOV) of 2-photon calcium imaging. Overlay: all touch-responsive ROIs. Color: preferred angle of angle-tuned neurons. Black line: non-selective touch neurons. White dash: C2 column boundary. Scale bar, 100 μm. (i–iv) Examples (yellow arrows in FOV) of specific-, broad-, complex-tuned, and non-selective neurons, respectively. (Top) Averaged inferred spikes across trials grouped by object angle. (Bottom) Average number of inferred spikes per touch grouped by object angle. (ii) is also shown in (A) and Figure 4A.
(D) Normalized activity of all angle-tuned neurons (12 naive mice), sorted by maximally preferred angle.
(E) Proportion of neurons that prefer each object angle.
(F) Proportion of angle tuning types (C) for L2/3 and L4. Uncorrected paired t tests.
(G) Distribution of preferred angle for L2/3 and L4.
Data are shown in means ± SEMs.
See also Figure S3.

