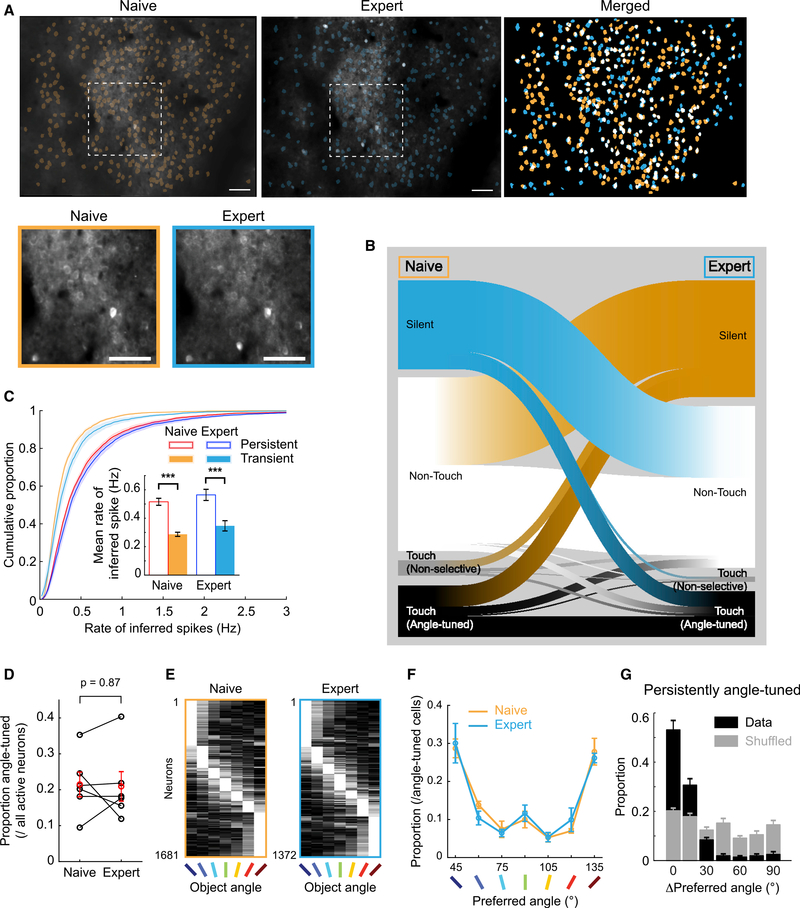
Figure 6. Stable Object Angle Preference Despite Active Ensemble Turnover after 2-Angle Discrimination Training.
(A) Example FOV (same as Figure 3) of active ROIs from 7-angle test sessions before (left) and after (center) 2-angle training. (Right) Overlay with persistently active in white. (Bottom left) Magnified view of white dashes above. Scale bars: 100 μm (top), 50 μm (bottom).
(B) Classification flow of 11,351 active neurons in 6 mice from naive to expert 7-angle test session.
(C) Cumulative proportion of rate of inferred spikes from persistent (active in both sessions) or transient (active in only 1) neurons in naive or expert 7-angle test sessions. (Inset) Mean rate of inferred spikes with paired t tests.
(D) Proportion of active neurons that were angle tuned in naive and expert 7-angle test sessions. Paired t test.
(E) Normalized activity of all angle-tuned neurons from 6 expert mice in naive and expert 7-angle sessions, sorted by maximally preferred angles.
(F) Distribution of preferred angles in naive and expert mice.
(G) Distribution of change in preferred angles in persistently angle-tuned neurons across training (black bars). Gray bars: shuffled data.
Data are shown in means ± SEMs.
See also Figures S6 and S7.

