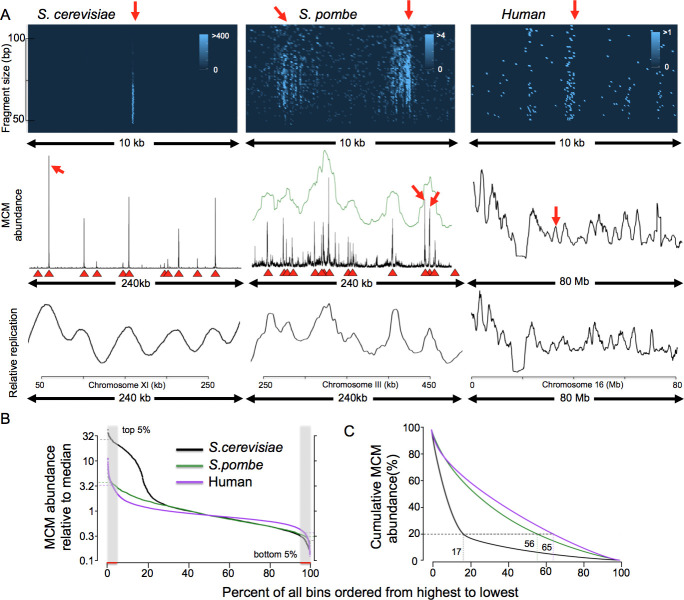
Fig 2. MCM distribution and replication in yeasts and human.
(A) 3x3 grid summarizing MCM binding and DNA replication in S. cerevisiae, S. pombe and human (HeLa). Left 3 panels show budding yeast (chr. XI), middle three panels show fission yeast (chr. II) and right 3 panels show HeLa cells (chr. 18). For Mcm2-ChEC experiments (top 2 rows), budding yeast were arrested for 2 hours with alpha factor, log phase fission yeast were transferred to medium containing 15 mM HU for 3 hours, and HeLa cells were arrested with contact inhibition. Top row: Mcm2 binding visualized by plotting chromosomal location on the x axis, fragment size on the y axis, and read depth indicated by color intensity, as described in the text. The budding yeast image corresponds to ARS1103 and the fission yeast to II-448. Middle row: Mcm2-ChEC read depths of all fragment sizes are plotted across 240 kb (both yeasts) or 80 Mb (HeLa). Green line in the middle plot (S. pombe) shows Mcm2-ChEC read depths divided into 1 kb bins and smoothed with a 15 bin sliding window. Red triangles in both yeasts indicate known origins of replication, as listed in oridb.org. Red arrows indicate regions of correspondence between the top and middle rows. Bottom row: Replication as determined by S to G1 ratio of flow sorted cells for budding and fission yeast, and by BrdU incorporation for HeLa. (B) MCM distribution expressed as fraction of median value for 5 kb-binned Mcm2-ChEC signal. S. cerevisiae, S. pombe, and HeLa are shown in black, green and purple, respectively. For each organism, the ratio of the median value in the 5% of bins with the highest MCM abundance (hatched region on left) to that in 5% of bins with the lowest abundance (hatched region on right) provides a metric for the degree of MCM dispersion in each organism. (C) Cumulative distribution of 5 kb-binned Mcm2-ChEC signal of all fragment sizes in S. cerevisiae, S. pombe and HeLa. The highly focused MCM signal in S. cerevisiae, as opposed to S. pombe and humans, is clear based on the observation that 80% of the S. cerevisiae signal is concentrated in just 17% of the genomic bins, whereas 56% and 65% of the bins were required to capture the same fraction of total signal in S. pombe and humans, respectively.

