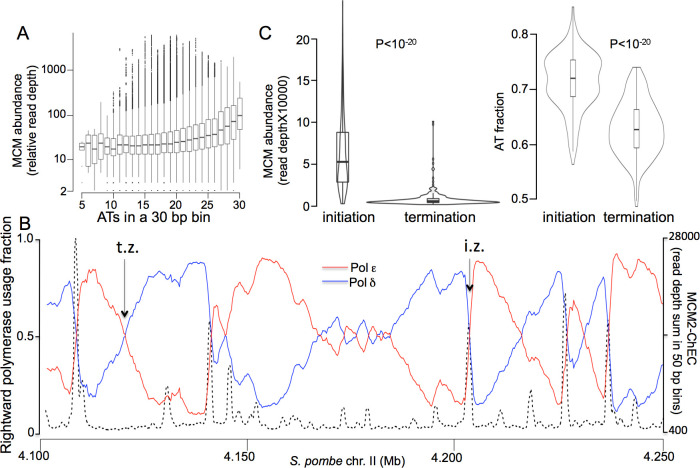
Fig 6. MCM binding preference in S. pombe with respect to AT content and replication initiation and termination zones.
(A) MCM signal as a function of AT content was determined by dividing the genome into 30 base pair bins and measuring average MCM signal in all bins with 30/30 As and Ts, 29/30 As and Ts, etc. (B) Percentages of rightward moving polymerases (i.e. polymerases that are involved in creating the newly synthesized Watson strand) that are leading- (pol ε) and lagging-strand (pol δ) polymerases, as determined by Pu-seq [47], are shown in red and blue, respectively. MCM abundance, expressed as Mcm2-ChEC signal read depth sum of all fragment sizes in 50 bp bins on the left Y-axis, is indicated by dotted black lines. Zones at which leading- and lagging-strand polymerases diverge sharply indicate replication initiation zones; these appear as sharp downward movements of the blue trace with coincident sharp upwards movements of the red trace. Zones at which leading- and lagging-strand polymerases from adjacent replication initiation zones converge indicate replication termination zones; these appear as gradual downwards movements of the red trace with coincident gradual upwards movements of the blue trace. (C) Comparison of MCM levels at all initiation versus termination zones on chr. II. Initiation and termination zones were determined as described in Materials and Methods. Violin plot shows distribution of relative read depths. Box shows interquartile range; horizontal line shows median; horizontal line in box shows median; vertical lines extending above and below box show distance to point farthest from interquartile range that is still within 1.5 interquartile ranges from the edge of the box; any points outside of this range are shown as individual points. Mean value for initiations was 0.19 (relative per-base-pair read depth), with 95% confidence intervals extending from 0.17 to 0.21; for terminations, mean was 0.023, with 95% confidence intervals extending from 0.020 to 0.027, P < 10−20. (D) Comparison of AT content at all initiation versus termination zones on chrII. Mean value for initiations was 0.715 with 95% confidence intervals extending from 0.709 to 0.721, and mean value for terminations was 0.629 with 95% confidence intervals extending from 0.622 to 0.635, P = 10−20.

