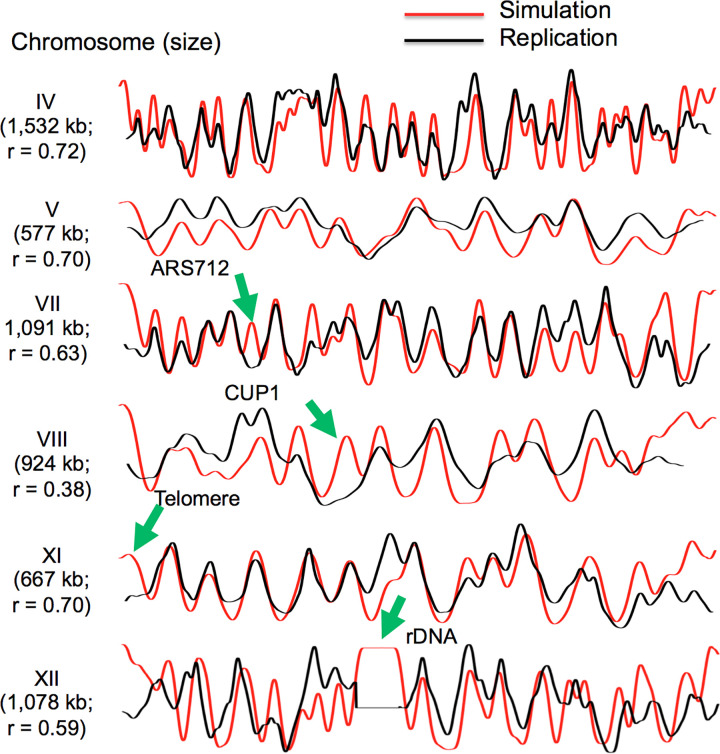
Fig 8.
Comparison of replication simulations (red) and replication, as assessed by read depth ratios of S phase to G1 phase flow-sorted cells [50] for six S. cerevisiae chromosomes. Green arrows indicate sites that replicate later than would be predicted based on simulations including repetitive rDNA repeats, telomeres CUP1 locus and ARS712. Delayed activation of these well-licenced origins indicates their control at the level of origin firing. ARS712, which has been shown to contain both ORC and MCM in ChIP studies [52], is not active during unperturbed replication, but is active in rad53 mutants subjected to hydroxyurea [51]. Correlation coefficients (r) between simulations and replication data are indicated. Mcm2-ChEC read depth of all fragment sizes was used for calculating MCM abundance.

