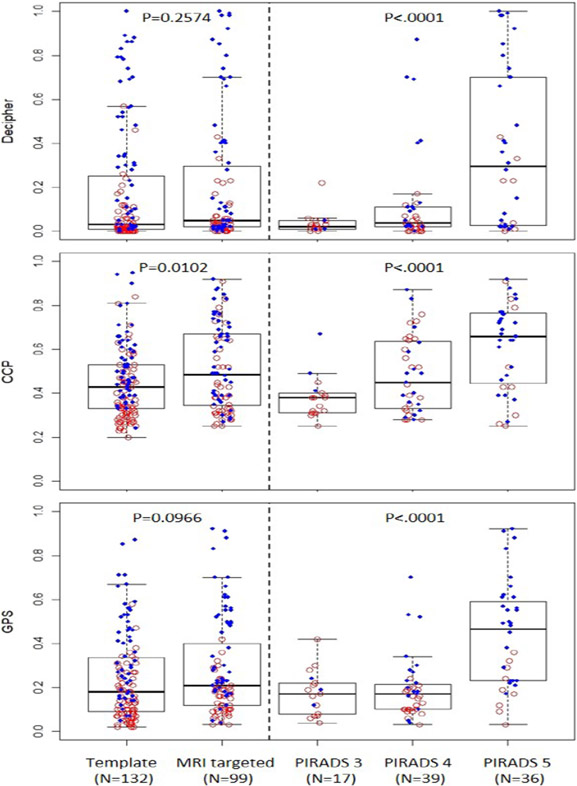
Figure 2:
Boxplot of genomic risk scores by template and MRI guided biopsies for each tissue-based genomic prognostic signatures (Decipher, CCP, GPS) showing higher CCP scores in MRI targeted compared to template biopsies, but no difference in GPS and Decipher scores. Within MRI targeted biospies all signatures showed higher scores with higher PIRADS levels.
Red circles depict biopsies from MAST trial; Blue dots – from BlastM.

