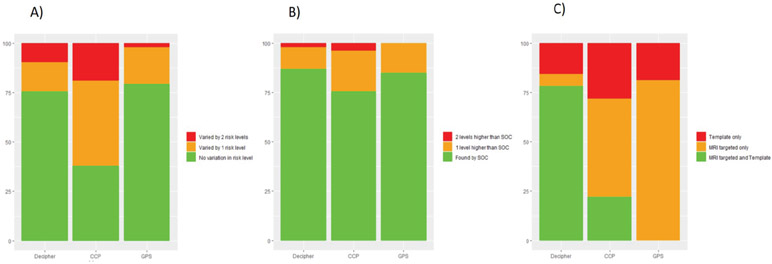
Figure 4:
a) shows how often the genomic risk level assignment for each signature was consistent among the biopsy cores and how often they differed by one or two risk levels. Variance in Decipher and GPS scores appeared similar (p=0.77), while they both differed from variance in CCP scores (p<0.01). b) shows how often the core with largest volume of highest grade cancer found the highest genomic risk level among the biopsy cores and how often one or two risk levels higher are found in a different core for each signature. There was no difference between signatures in this distribution (p>0.1). c) shows the how often MRI guided and template biopsy identified the highest genomic risk level among the biopsy cores for each signature. There was a significant difference between all the signatures in this distribution (p<0.01).

