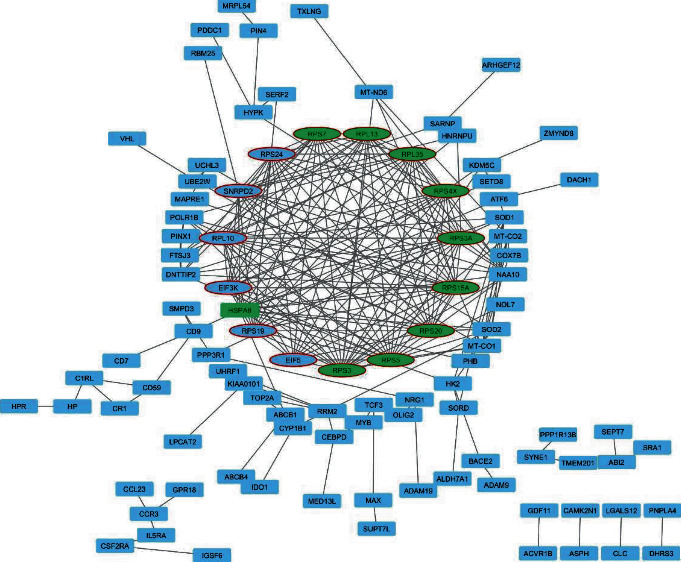
Figure 4.

Protein-protein interaction network. The PPI network was constructed using STRING and visualized with Cytoscape. The selected top 10 genes with a high degree were shown in green. The nodes related to the significant module were shown in ellipse shapes.
