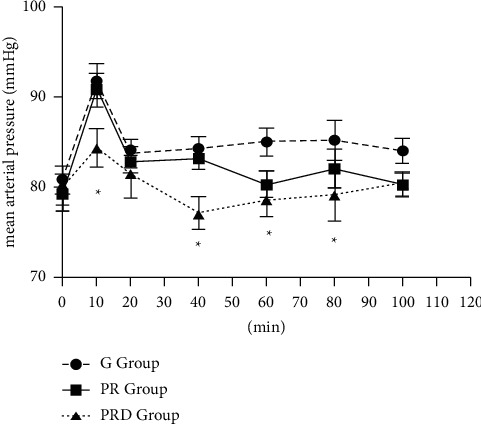
Figure 5.

Intraoperative MAP values in all groups. The PRD group compared to the G group and PR group except at 20 min and 100 min (∗p < 0.05). There were significant differences between the G group and PR group at 60, 80, and then 100 min; the G group and PRD group at all time points except 20 min; and the PR group and PRD group at 20 and 100 min (p < 0.05).
