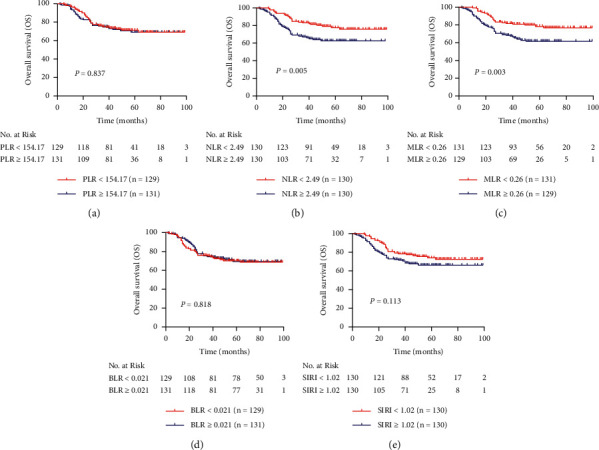
Figure 3.

Kaplan–Meier curves for overall survival of patients with stage IIB cervical cancer in different subgroups of (a) PLR, (b) NLR, (c) MLR, (d) BLR, and (e) SIRI.

Kaplan–Meier curves for overall survival of patients with stage IIB cervical cancer in different subgroups of (a) PLR, (b) NLR, (c) MLR, (d) BLR, and (e) SIRI.