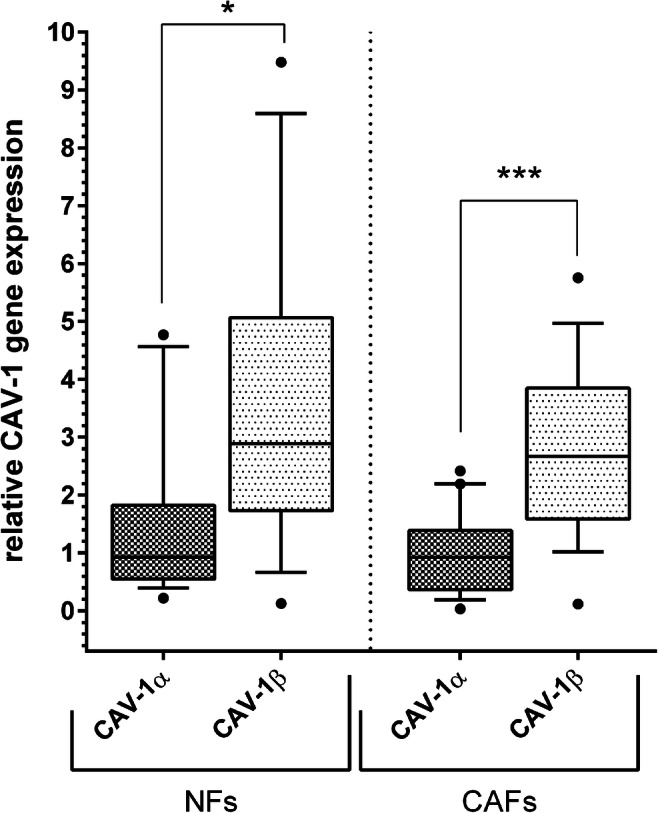
Fig. 2.

Relative expression of the mRNA of the Cav-1 isoforms Cav-1α and Cav-1β in NFs (left) and in CAFs (right). In normal fibroblasts as well as in cancer-associated fibroblasts of the same patients, CAV-1β expression was more pronounced than CAV-1α expression. Data is shown as box and whisker plots with median and 10 to 90 percentiles, outliers are shown as dots, and Wilcoxon test was used for comparison of isoform expression between NFs (n = 18) and CAFs (n = 19), * p < 0.05, ** p < 0.01, *** p ≤ 0.001
