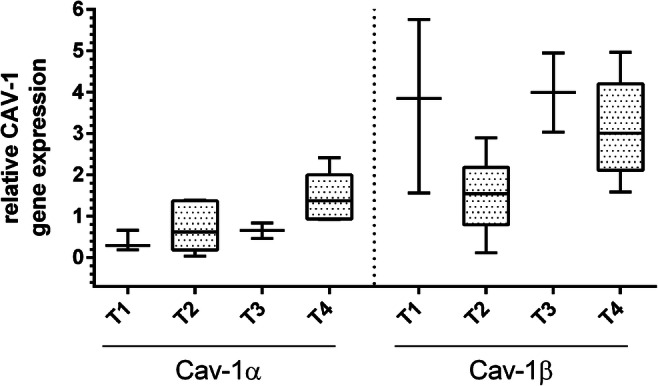
Fig. 3.

Expression of mRNA of Cav-1α and Cav-1β in the CAFs, divided into the tumor stages T1 to T4. The expression of the Cav-1α isoform was lower than the expression of Cav-1β trough all tumor stages. With higher tumor stages, there was a slight trend for higher Cav-1α expression, while Cav-1β expression was heterogenous throughout the different tumor stages. Data is shown as box and whisker plots with median and 10 to 90 percentiles, and Kruskal-Wallis test was used for comparison between expression in CAFs of different tumor stages, n = 19. * p < 0.05, ** p < 0.01, *** p ≤ 0.001
