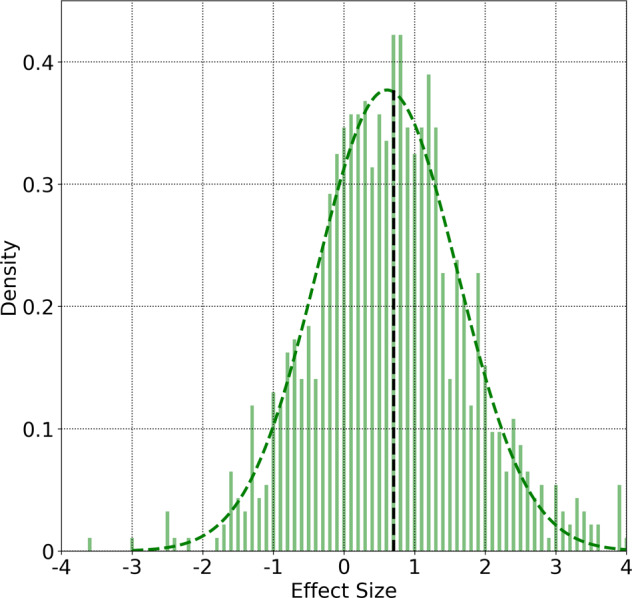
Fig. 5. Effect size distribution.

Distribution of Cohen’s d effect sizes comparing respiratory rates in two-time windows, for symptomatic individuals: A 7-day period from D−24 to D−18, and a 7 day window from D−1 to D+5. We only consider subjects with at least 5 days of data in the 7 day period. The curves are normalized to unit area. Also shown is a gaussian fit to the data. The vertical line indicates the mean value of the effect size distribution (+0.70).
