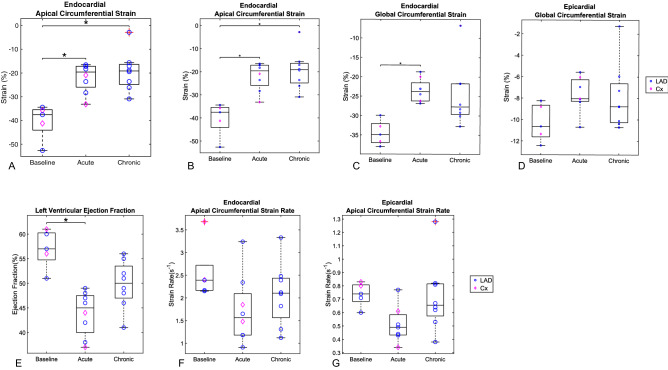
Figure 3.
(A-D) Overtime changes in apical and global circumferential strains. (A) Endocardial apical circumferential strain (ACS); (B) Epicardial apical circumferential strain (ACS); (C) Endocardial global circumferential strain (GCS); (D) Epicardial global circumferential strain (GCS). The two data points at the chronic time point with a red cross (in endocardial ACS and GCS) represent outliers greater than the third quartile plus 1.5 times the interquartile range. (E–G): Overtime changes in LVEF, endocardial and epicardial ACS rates. (E) Left Ventricular Ejection Fraction (LVEF); (F) Endocardial apical circumferential strain (ACS) rates; (G) Epicardial ACS rates. The asterisk denotes changes considered significant with p < 0.0024. Statistical test: Mann–Whitney (* = identifies significant difference)”.

