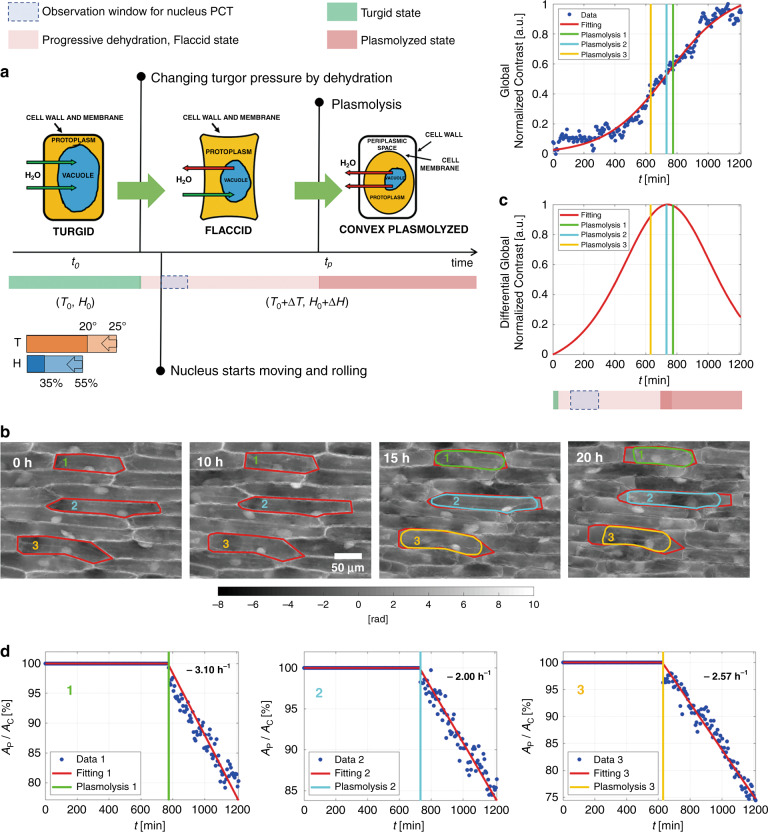
Fig. 1. (Supplementary Movie 1) Exploiting induced dehydration in onion epidermal cells.
a Sketch of the induced change in a cell turgor pressure due to the cell aqueous content. Cell dehydration can be induced acting on the environmental temperature, T, and Humidity, H. The released nucleus is free to move and rotate. Dehydration also allows imaging the cell with enhanced phase contrast, thus boosting the optical system sensitivity. Within the observation window, nucleus rotation is exploited for PCT. b Four QPMs at different times with the cell walls highlighted in red and the corresponding cell membranes after the start of plasmolysis shown in green, cyan, and yellow. c Top: global image contrast normalized between 0 and 1, with the logistic fitting overlapped in red. Bottom: differential global normalized contrast, i.e., the time derivative of the logistic function, whose peak marks the breaking plasmolysis event. The vertical lines correspond to the plasmolysis times, i.e., tP1 = 12.9 h for the first cell, tP2 = 12.2 h for the second cell, and tP3 = 10.5 h for the third cell. d For each cell, the temporal trend of the percentage ratio between the protoplast area, AP, and the cell area, AC, with a linear fitting overlapped in red. Values at the top right corner are the angular coefficients of the linear fitting after the plasmolysis event

