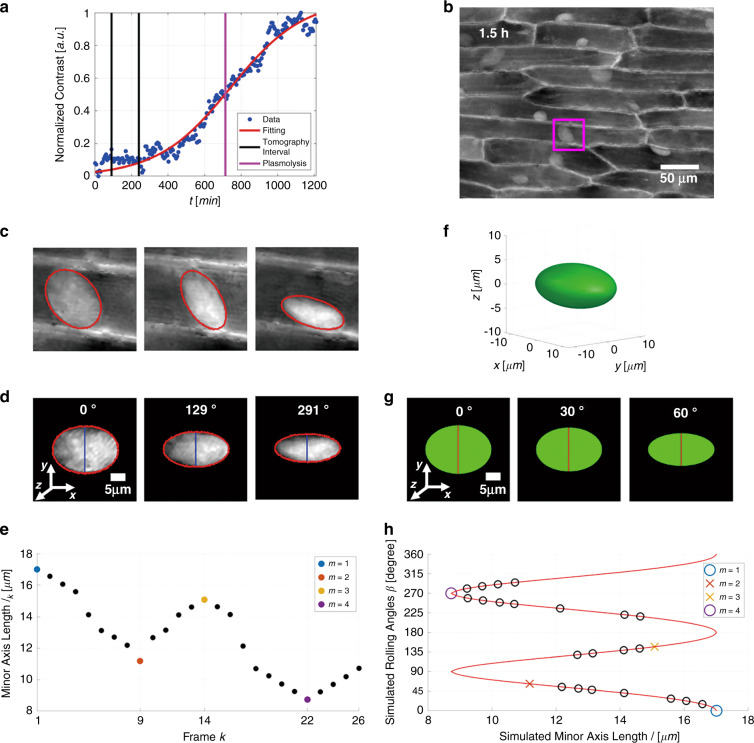
Fig. 4. (Supplementary Movie 5) Rolling angle recovery method (see also “Materials and methods”).
a Global image contrast normalized between 0 and 1, with overlapped in red the logistic fitting. The vertical black lines delimit the interval of frames used to perform the tomographic reconstruction of the analyzed nucleus (from 1.5 to 4 h), while the vertical violet line corresponds to the plasmolysis of the surrounding cell (12 h). b QPM at 1.5 h with highlighted in violet the ROI containing the analyzed nucleus (36.6 × 36.6 μm). c ROIs taken from three QPMs, with overlapped in red the contours of the elliptic binary masks. d Segmented QPMs in (c), centered and rotated to align the minor axes (in blue) along the y-direction of the reference system. At the top of each image, the corresponding recovered rolling angle is reported. The scale bar is 5 μm. e Minor axes’ lengths lk of the elliptic binary masks of the same nucleus in the various frames k. The four colored dots are the extreme points m of the curve. f Silhouette of the nucleus simulated as an ellipsoid, according to the shape and the size of its segmented phase maps. g Three projections of the ellipsoid in (f) in the xy-plane, obtained by rotating it around the x-direction at the angles reported at the top of each image and by summing along the z-direction. Red lines are their minor axes. The scale bar is 5 μm. h Minor axes’ lengths l of the projections of the numerical ellipsoid in (f) versus the simulated rolling angles β (red line). Circles and crosses are the recovered rolling angles θk corresponding to the minor axes’ lengths lk in (e). For the sake of clarity, only one of the two possible determinations of the estimated angles for m = 2 and m = 3 is shown in (h) by colored crossed. Due to the ambiguity, such angles are not considered here for PCT

