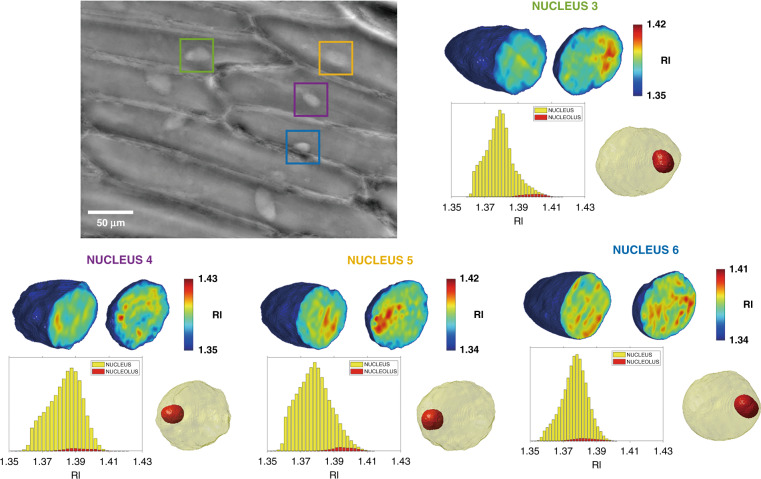
Fig. 6. (Supplementary Movie 7) Tomographic reconstructions of four plant cells’ nuclei captured under red laser light.
For each nucleus, marked with colored boxes in the QPM, the central slices taken from the 3D reconstructed tomograms are shown along two different directions. The corresponding histograms of the RI distribution of the nucleus (yellow) and the nucleolus (red) are reported, along with the iso-levels representation with the nucleolus highlighted in red

