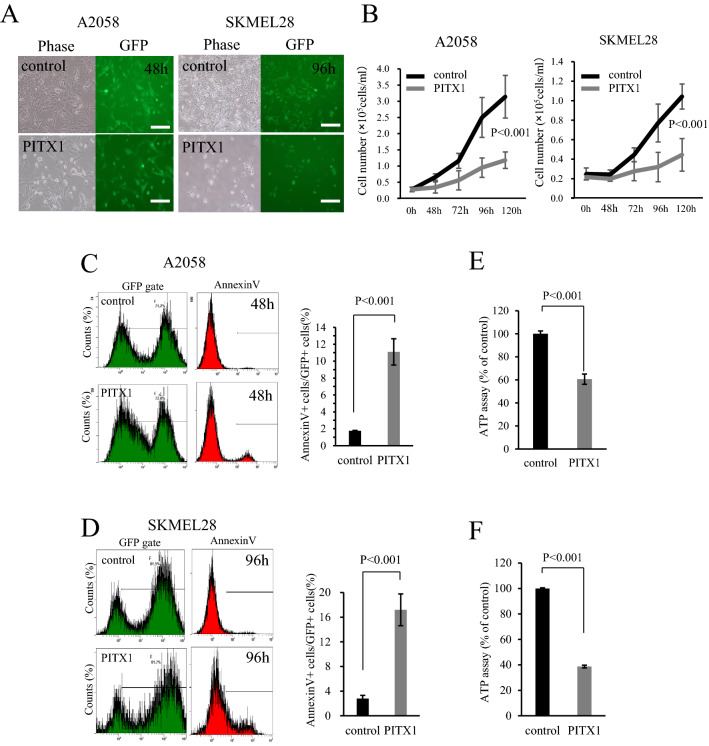
Figure 1.
Overexpression of PITX1 inhibits melanoma proliferation. (A) A2058 and SKMEL28 cell lines were infected with control and PITX1 expression lentivirus vectors. Infection efficiency was monitored after 48 h or 96 h by fluorescence analysis of vector-encoded GFP (right panels). Phase contrast images are shown at left. Scale bars: 100 µm. (B) Number of PITX1 transfected cells and control cells over 5 days. A2058 cells are shown at left, and SKMEL28 cells are shown at right. Bars correspond to means ± S.D. for three independent experiments (P < 0.001). Curve images of growth were created using Excel. (C,D) Flow cytometric analysis of apoptosis in PITX1 overexpressing cells (C: A2058, D: SKMEL28). Quantification of apoptosis as % Annexin V positive cells in GFP positive gate. Bars correspond to means ± S.D. of three independent experiments (P < 0.001). Annexin V-positive cell count images were created using Kaluza software, and the bar graphs were created using Excel. (E,F) ATP assay in PITX1-overexpressing cells (E: A2058, F: SKMEL28). ATP content was measured using CellTiter-Glo 2.0 After Assay Kit at 96 h after infection with PITX1 expressing or control lentivirus vector. Values are expressed as a percentage of control. Bars correspond to the means ± SD of three independent experiments (P < 0.001). These bar graphs were created using Excel.

