Figure 2.
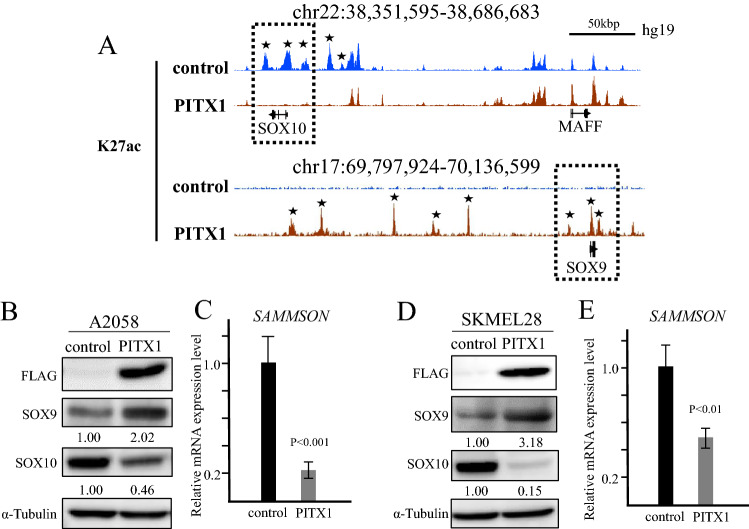
H3K27ac ChIP-seq in PITX1-expressing cells. (A) Integrated Genome Browser (IGB) screenshots of ChIP-seq data shows H3K27ac at the SOX9 and SOX10 loci in PITX1 overexpressing A2058 (red) and control cells (blue). Stars indicates the regions where the peak of H27Kac differs between PITX1-overexpressing cells and control cells. (B) Western blotting analysis of the protein level of PITX1 (Flag tagged), SOX9 and SOX10 in A2058 cells at 48 h after infection with PITX1 expressing or control lentivirus vector. The expression levels of SOX9 and SOX10 were normalized to α-tubulin levels. Cropped blots were used in this figure. Original full-length blots are presented in Supplementary Fig. S8. (C) qRT-PCR analysis of relative SAMMSON RNA expression levels in PITX1 and control lentivirus vector infected A2058 cells. Expression in the vector control cells was arbitrarily set at 1. GAPDH mRNA expression was used as the internal control. Data are presented as means ± S.D. of three independent experiments (P < 0.001). (D) Western blotting analysis of the protein level of PITX1 (Flag tagged), SOX9 and SOX10 in SKMEL28 cells at 48 h after infection with PITX1 expressing or control lentivirus vector. The expression levels of SOX9 and SOX10 were normalized to α-tubulin levels. Cropped blots were used in this figure. Original full-length blots are presented in Supplementary Fig. S8. (E) qRT-PCR analysis of relative SAMMSON RNA expression levels in PITX1 and control lentivirus vector infected SKMEL28 cells. Expression in the vector control cells was arbitrarily set at 1. GAPDH mRNA expression was used as the internal control. Data are presented as means ± S.D. of three independent experiments (P < 0.01). All the bar graphs were created using Excel.

