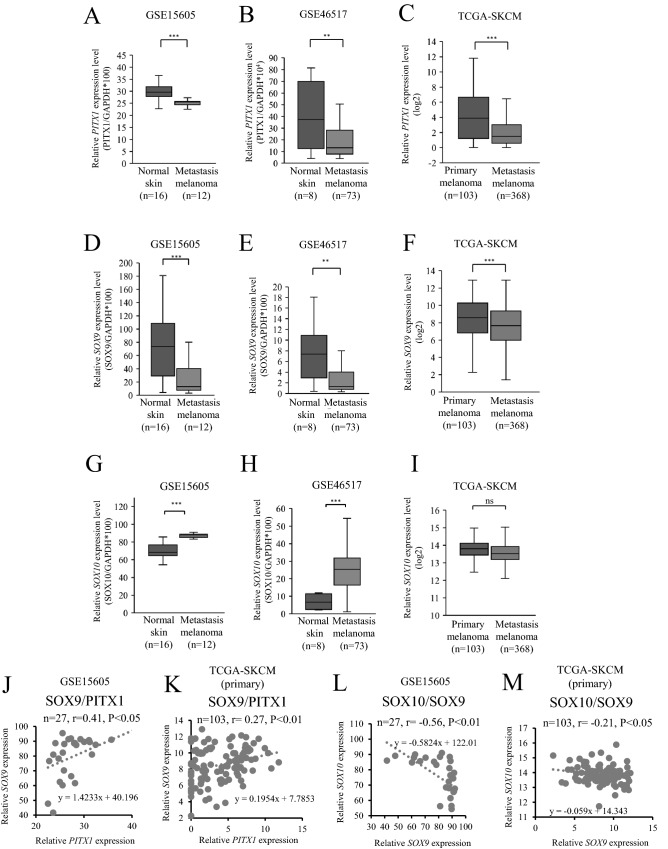
Figure 4.
PITX1 and SOX9 are positively correlated in clinical melanoma tissues. (A–I) The relative expression levels of PITX1, SOX9, and SOX10 in metastatic melanoma samples and normal skin or in primary and metastasis melanoma samples were determined using the GSE15605, GSE46517, and TCGA-SKCM RNA-seq datasets. The expression levels were normalized to GAPDH in GEO dataset (**P < 0.01, ***P < 0.001). The expression levels showed log2 scale in the TCGA dataset (***P < 0.001, ns: not significant). (J) Relationship between PITX1 mRNA expression level and SOX9 mRNA expression level in metastatic melanoma samples and normal skin. Pearson’s correlation coefficient (r) was calculated for PITX1 and SOX9 mRNA expression levels in the sixteen normal skin and twelve metastatic melanoma samples. (K) Relationship between PITX1 and SOX9 mRNA expression levels in metastatic melanoma samples and normal skin. Pearson’s correlation coefficient (r) was calculated for PITX1 and SOX9 mRNA expression levels in 103 primary melanoma samples. (L) Relationship between SOX10 mRNA expression level and SOX9 mRNA expression level in metastatic melanoma samples and normal skin. Pearson’s correlation coefficient (r) was calculated for SOX10 and SOX9 mRNA expression levels in the sixteen normal skin and twelve metastatic melanoma samples. (M) Relationship between SOX10 and SOX9 mRNA expression levels in metastatic melanoma samples and normal skin. Pearson’s correlation coefficient (r) was calculated for SOX10 and SOX9 mRNA expression levels in 103 primary melanoma samples. Box and scatter plots were created using Excel.

