Figure 5.
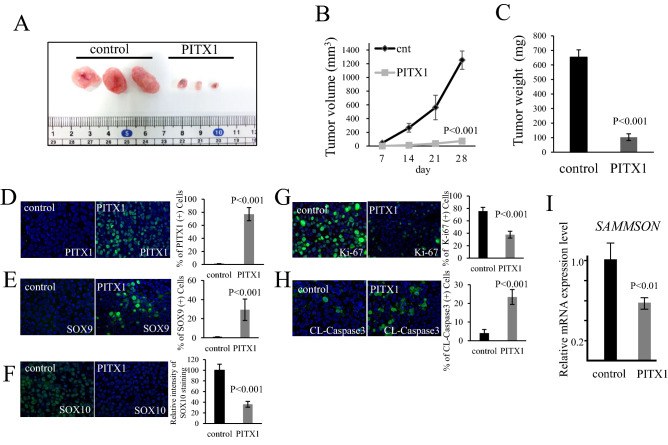
PITX1 inhibits tumor growth in vivo. (A) Photograph of subcutaneous tumors generated in Balb-c/nu/nu mice with PITX1 transfected A2058 cells and that of the control. The left shows the control (n = 3), and the right shows PITX1 (n = 3). (B,C) Quantification of tumor volume and weight in PITX1 and control samples. The tumor volume curve and bar graph for tumor weight were created using Excel. (D–H) Immunostaining of paraffin sections of the subcutaneous tumors for PITX1, SOX9, SOX10, Ki-67 and cleaved caspase-3 (FITC: Green). DAPI staining for nuclei (blue). Merged FITC and DAPI fluorescent images are shown. Each individual channel’s image is shown in Supplementary Fig. S4. Bar graph shows the number of positive expressing cells (or relative intensity level) for each gene in the PITX1 sample compared to control. Data are presented as means ± S.D. for three independent experiments (P < 0.001). Scale bars: 100 µm. (I) qRT-PCR analysis of relative SAMMSON RNA expression levels in the subcutaneous tumors. Control cells were arbitrarily set as 1. GAPDH mRNA expression was used as the internal control. Data are presented as means ± S.D. for three independent experiments (P < 0.01).

