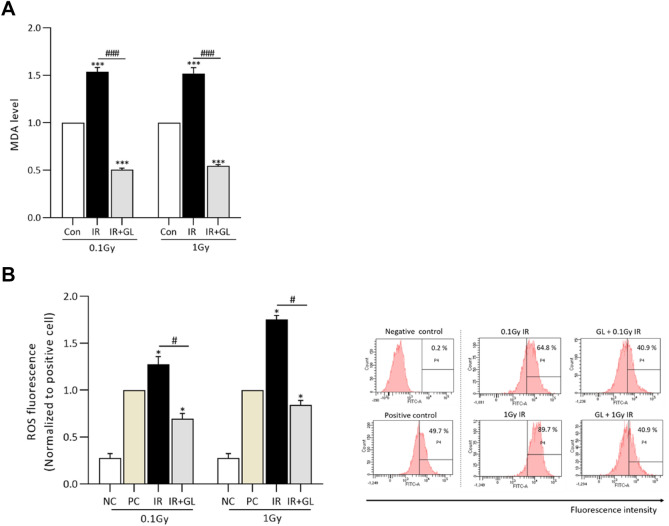
Figure 1.
Oxidative stress measured by the MDA assay according to radiation dose. (A) The graph shows the normalized levels of MDA for the IR with/without GL groups compared to the control group. Oxidative stress was significantly higher in the IR only groups compared to the controls, whereas it was attenuated in the IR + GL groups. (B) ROS fluorescence was measured using flow cytometry at 24 h. It significantly higher in the IR only groups compared to the positive controls, whereas it was lower in the IR + GL groups. Measeured values normalized to the positive controls (= H2DCFDA stained cells). Results are expressed as means ± SEM from duplicate experiments (n = 5) performed in each group. The asterisk (*) indicates statistically significant differences between the control and IR groups (both IR only and IR + GL). The hash sign (#) indicates significant differences between the IR only groups and IR + GL groups. *p < 0.05, ***p < 0.001 #P < 0.05 and ###p < 0.001. Abbreviation: IR irradiation, GL glycyrrhizin, MDA malonaldehyde acid, ROS reactive oxidative species, NC negative control, PC positive control.

