
Figure 3.
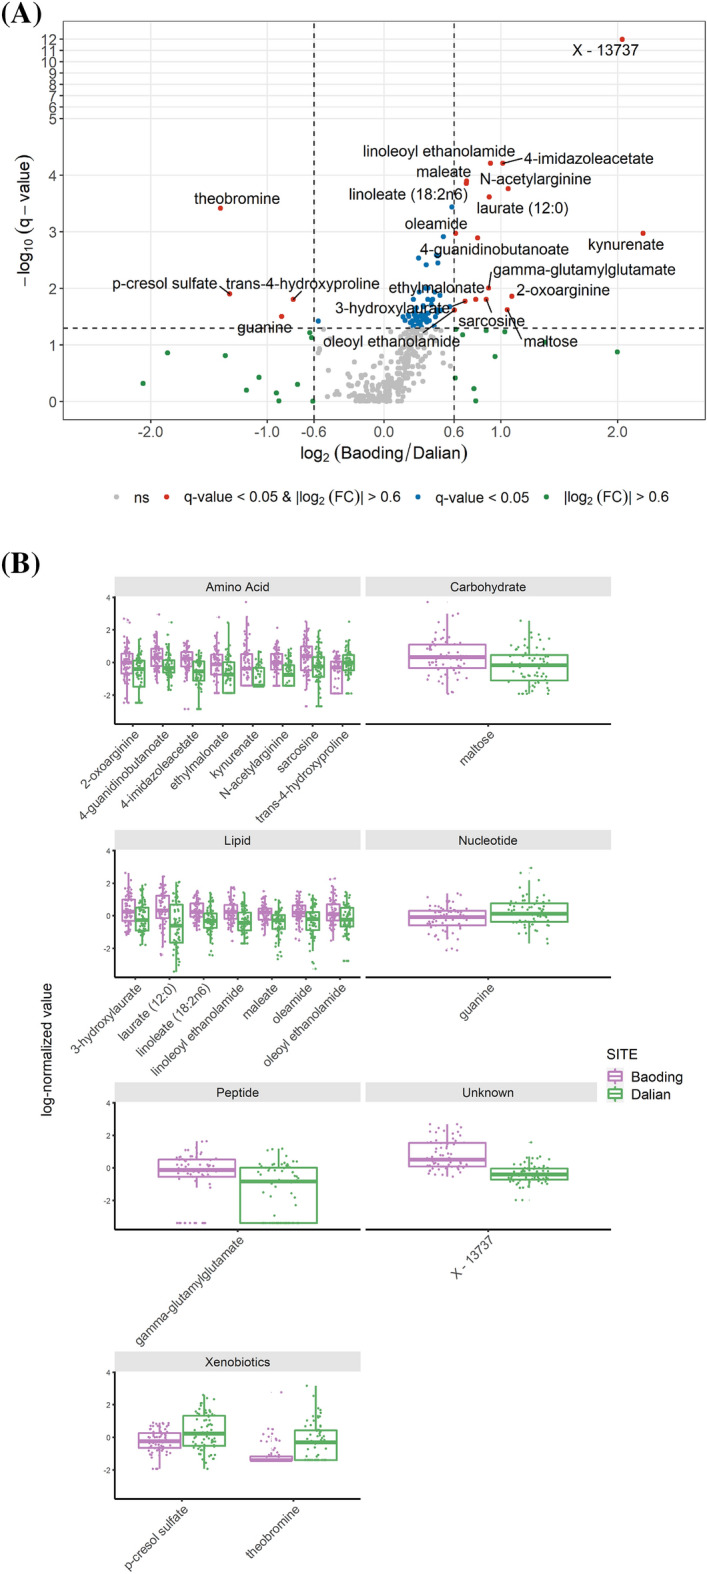
(A) Volcano plot representing the log2(FC) in x-axis and -log10(q − value) in y-axis. A threshold of 0.6 for the log2(FC) is added as a dotted vertical black line and a threshold of − log10(0.05) as a dotted horizontal black line for the q-value. For representation purpose, the y-axis scale has been squashed by a factor of 5 between 5 and 12. A metabolite is considered significantly modulated if its |log2(FC)|> 0.6 and q-value < 0.05 (in red and labelled on the figure). (B) Boxplots of significantly modulated metabolites, gathered by pathway, Baoding (More Polluted) and Dalian (Less Polluted). Figures were created using the R software: R Core Team (2017), R Foundation for Statistical Computing, Vienna, Austria. URL https://www.R-project.org/.