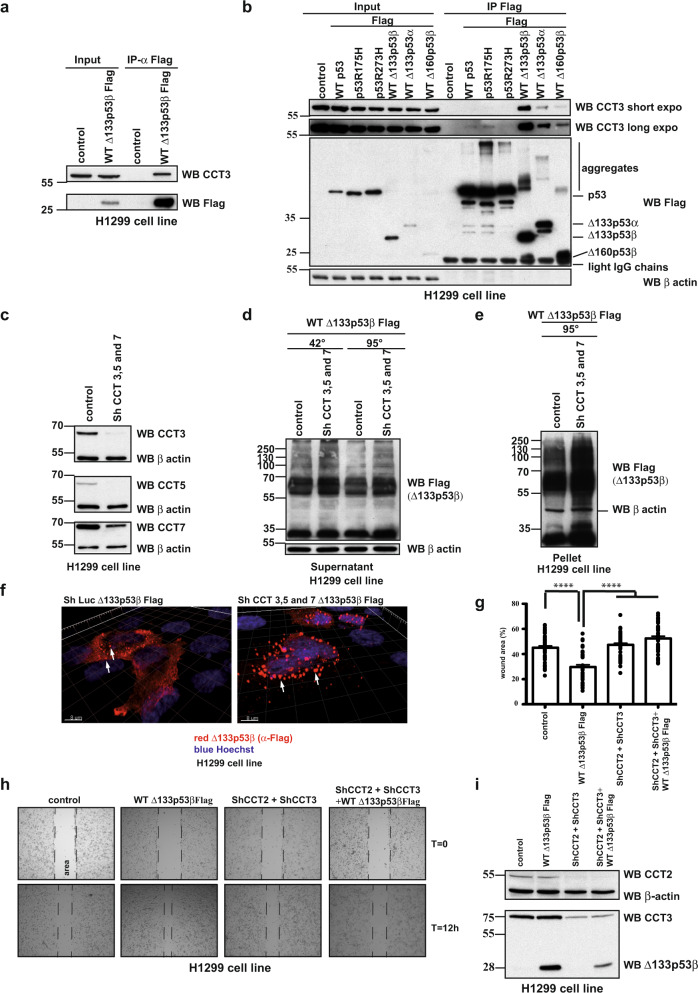
Fig. 3. CCT complex actively participate in regulation of Δ133p53β aggregation and its activity.
a Co-immunoprecipitation analysis of CCT3 subunit and WT Δ133p53β in H1299 cells. n = 3. b Co-immunoprecipitation analysis of CCT3 subunit with different p53 and Δ133p53 isoforms in H1299 cells. n = 3. c Western blot analysis of CCT complex subunit depletion in H1299 cells. n = 2. d Western blot analysis of the soluble protein fraction from H1299 cells after WT Δ133p53β transfection in control and CCT3, 5 and 7 depleted backgrounds. n = 3. e Western blot analysis of the insoluble protein fraction from H1299 cells after WT Δ133p53β transfection in control and CCT3, 5 and 7 subunit depleted backgrounds. n = 3. f. Immunofluorescent analysis of WT Δ133p53β aggregates in control and CCT3, 5 and 7 subunits depleted H1299 cell line upon 3D reconstruction of the confocal Z-stacks. Red: α-Flag (Δ133p53β), blue: Hoechst. Scale bar 8 μm. n = 3. g Quantification of the migration ability of the H1299 cell expressing Control, WT Δ133p53β or CCT complex depleted background at t = 12 h after wound-healing, n = 3. Values are the mean of ±SEM (error bars) pooled from three independent experiments with 15 images for each sample in each experiment (total 45 images/sample). Statistical analysis was performed using non-parametric Mann–Whitney t test with the Prism software (GraphPad). All p values are <0.0001. h Phase contrast images of wound-healing migratory assay of H1299 cells expressing WT Δ133p53β in control or CCT complex depleted background at the beginning (T = 0 h) and end of the test (12 h). Representative images of one out of three experiments are shown. i Western blot analysis of CCT complex subunit depletion in H1299 cells. Representative immunoblot of one out of three experiments from Fig. 3h is shown. The arrows indicate aggregates. Molecular weight is expressed in kDa. Source data are provided as a Source Data file.

