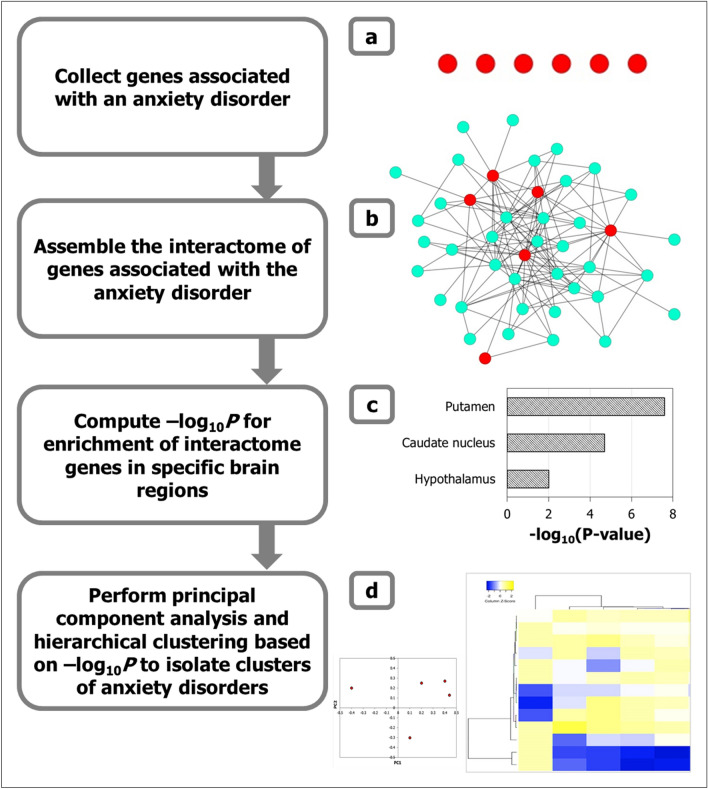
Figure 1.
Methodology to identify regional specificity of ADs in the brain. (a) Genes associated with six types of ADs were compiled (depicted as red nodes), and (b) their protein interactomes assembled by curating the interactions of the proteins encoded by them with other proteins (i.e. interactors depicted as cyan colored nodes in the network diagram). These protein–protein interactions or PPIs are depicted as edges in the network. (c) The enrichment of the individual ADIs with genes showing medium/high expression (TPM ≥ 9) in specific brain regions were computed, and the statistical significance of these enrichments were calculated as negative logarithm of p values (i.e. –log10P). TPM = transcripts per million. (d) Principal component analysis (PCA) was performed to identify specific grouping patterns from the data matrix of –log10P of enrichment of each ADI in specific brain regions. Principal components which explain a large percentage of the variance observed across this data matrix were identified, and the component loadings denoting the correlation of the original variables (− log10P of specific brain regions) with the principal components were examined to interpret the observed patterns. The data matrix was also subjected to hierarchical clustering to delineate closely related groups of ADs. In the heat map, regions were colored according to the z-scores indicating their mean enrichment in the ADI. The z-scores indicate the number of standard deviations that separate a given p value from the mean. High z-scores correspond to high enrichment for the specific region.

