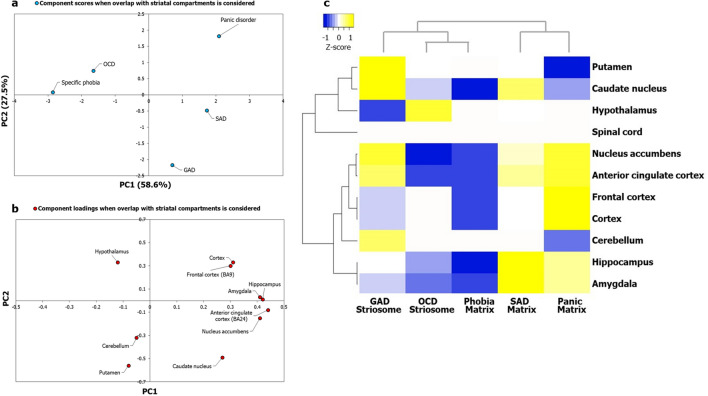
Figure 4.
Principal component analysis and clustering analyses of AD-SMIs revealed uneven influence of key brain regions linked to anxiety etiology and distinct AD groups. (a) PCA was performed with the p values of enrichment of genes that co-occur in specific ADIs and SMIs. As observed in Fig. 5, specific ADIs share discrete and distinct statistically significant overlaps with either SI or MI, namely, GAD and striosome, OCD and striosome, phobia and matrix, SAD and matrix, and panic disorder and matrix. The enrichment of these genes among those exhibiting high/medium expression in 13 brain regions (TPM > 9) compiled from GTEx was checked. The statistical significance of region-wise enrichment was computed as p values. These values were transformed to − log10P values, which were then assembled into a data matrix containing brain regions as rows and ADs as columns (represented as a heatmap in Fig. (c)). Unit variance scaling was applied across this matrix. Single value decomposition (SVD) with imputation was used to extract the principal components (PCs). Component scores of GAD-striosome, OCD-striosome, phobia-matrix, SAD-matrix and panic disorder-matrix (n = 5) corresponding to PC1 and PC2 explaining 58.6% and 27.5% of the total variance were plotted along X and Y axes respectively. (b) Component loadings of 10 dimensions, i.e. brain regions, contributing to PC1 and PC2 shown in (a) were plotted along X and Y axes respectively. In contrast with the pattern of component loadings of brain regions observed in Fig. 2b, PCA with genes shared between ADIs and SMIs appears to have captured uneven influences of several brain regions such as the ACC, amygdala, hippocampus, nucleus accumbens, putamen and caudate on the grouping patterns of ADs. (c) Variations in region-wise enrichment of genes (computed from GTEx data) shared between ADIs and SMIs are represented in the form of a heatmap. Specifically, normalized z-scores computed based on the –log10 transformed p values, indicating the statistical significance of enrichment of GAD-striosome, OCD-striosome, phobia-matrix, SAD-matrix and panic disorder-matrix, are shown in the figure. Z-scores indicate relative enrichment of specific brain regions in the gene sets and are computed based on the number of standard deviations that separate a given p value from the mean. Clustering was performed using the hierarchical clustering method with average linkage. The dendrograms were derived from the clustering analysis based on computation of Pearson correlation coefficients between the data points. Two main clusters were detected among the ADs. SAD and panic formed one cluster. OCD and phobia formed a sub-cluster within the second main cluster. GAD was an outgroup to the sub-cluster of OCD and phobia. The clustered heatmap was created using Heatmapper (http://www.heatmapper.ca/).

