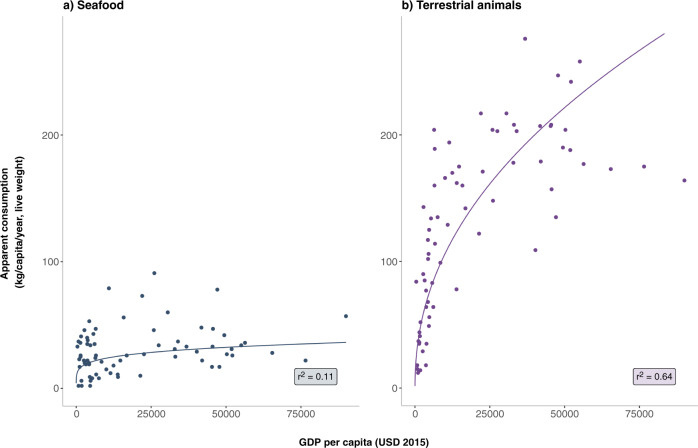
Fig. 1. Role of income in global seafood and meat consumption.
Relationship between apparent consumption (live weight) and GDP per capita for seafood (dark blue dots) and terrestrial animals (purple dots). Line of best fit modeled as y = axb. a Per capita fish consumption (yfish) as a function of per capita GDP (x) (yfish = 4.11x0.19; r2 = 0.11; r = 0.33). b Per capita terrestrial animal consumption (yanimal) as a function of GDP per capita (x) (yanimal = 1.56x0.46; r2 = 0.64; r = 0.80). The relationship between per capita consumption and GDP per capita is significantly weaker for fish than for terrestrial meat. Countries with very high per capita consumption of fish (>50 kg/cap/year, live weight) include French Polynesia, Maldives, Fiji, Antigua & Barbuda, Iceland, Malaysia, Barbados, Lithuania, Spain, South Korea, Portugal, and Norway. Data represent 2015 values for 72 countries with GDP and population data from The World Bank (https://data.worldbank.org/) and apparent consumption from FAOSTAT23.

