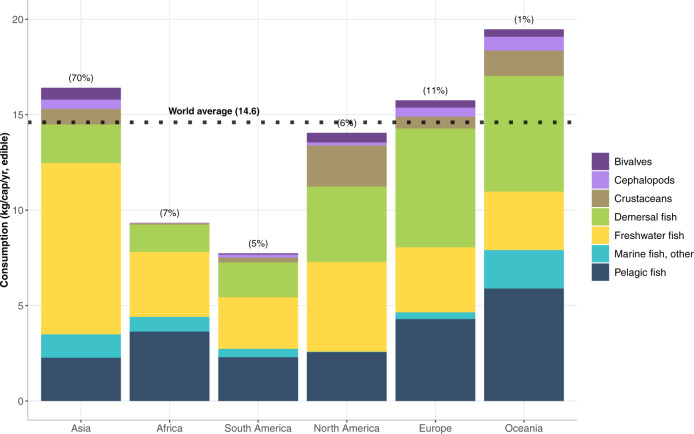
Fig. 3. Per capita apparent fish consumption by region and species group (kg/cap/year, edible weight) in 2015.
Numbers in parentheses above the bars represent the share of global consumption. Asia, Europe, and Oceania demonstrate a high level of edible fish consumption per capita in relation to the global average (14.6 kg/cap/year, edible). Fish consumption in North America is close to the global average, whereas Africa and South America are significantly below the global per capita average. Data Source: FAOSTAT23.

