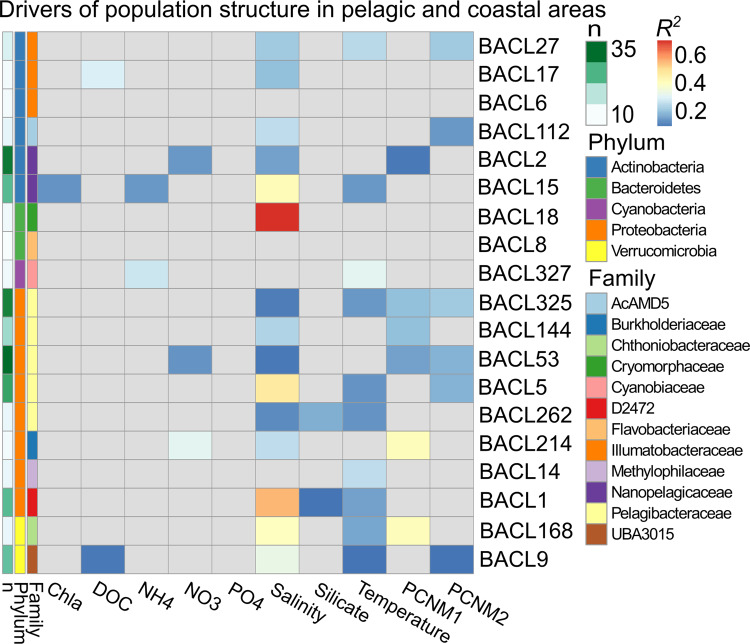
Fig. 4. Environmental drivers of population structure in 19 prokaryotic BACLs across the pelagic and coastal transects.
The number of samples (n) included for each BACL are indicated by the left-most column. Results stem from conditioned redundancy analyses. The PCNM variables represent the spatial relationship between sampling sites, reflecting pairwise geographic distances (shortest waterway distance). R2 values are colored from blue to red; only significant correlations are shown (p < 0.05).

