Figure 5.
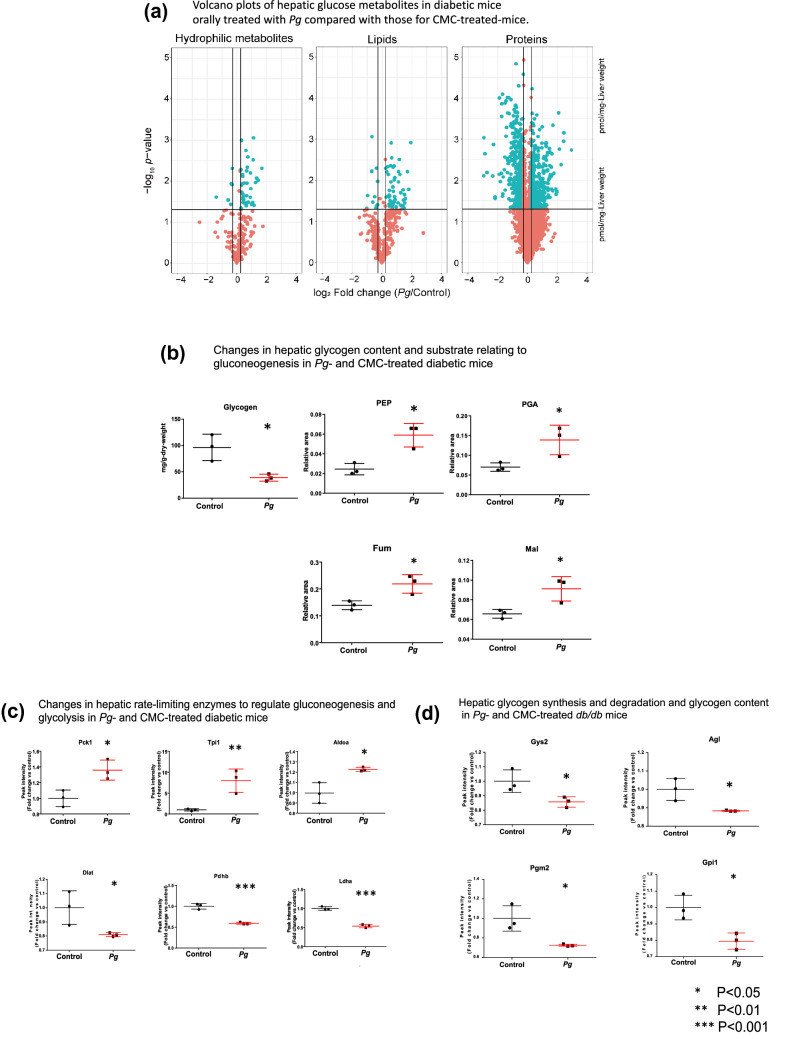
Proteome and metabolome profiles of the livers of db/db mice treated with Porphyromonas gingivalis (Pg) or CMC for 30 days, obtained using nano-LC/MS/MS, in triplicate. (a) Volcano plots of fold change in the levels of hydrophilic metabolites, lipids, and proteins, between Pg- and CMC-treated mice. Blue points represent significant increase or decrease (the relevant compounds are listed in Supplementary Tables S3 and S4–7). (b) The levels of glucose metabolites (PEP, PGA, FUM, and MAL) were significantly higher (P < 0.05), while the glycogen content was significantly lower (P < 0.05), in Pg-treated mice, compared to that in CMC-treated mice. (c) Comparative proteome analysis of the levels of glycolysis/gluconeogenesis-related enzymes in Pg- and CMC-treated mice. (d) Comparative proteome analysis of enzyme synthesis and degradation during glycogen and G6P metabolism via the glycolytic pathway in Pg- and CMC-treated mice. PCK1, ALDOA, and TPI1 were significantly upregulated; while, Pgm2, DLAT, GPI1, LDHA, PDH, Gys2, AGL, and Gpi 1 were significantly downregulated (c, d), in the Pg-treated mice, compared to that in the CMC-treated mice. Panels (b–d) Data normalized and statistically analyzed as for Fig. 4a. n = 3, *P < 0.05, **P < 0.01 and ***P < 0.001, versus control.

