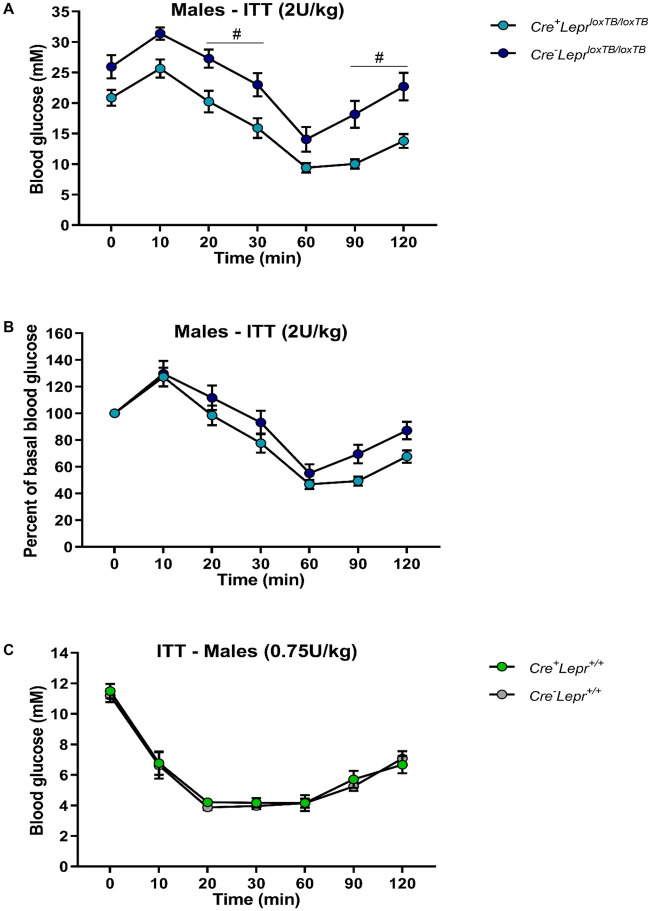
Figure 2.
Insulin tolerance tests (ITTs) in male mice from the Lepr reconstitution study. In (A), the insulin dose was 2U per kg of body weight. In (B), blood glucose concentration of each mouse in (A) was normalized to its basal (0 min) blood glucose concentration. In (C), the insulin dose was 0.75 U per kg of body weight. In (A) and (B), n = 18 for Cre+LeprloxTB/loxTB and n = 14 for Cre−LeprloxTB/loxTB; in (C), n = 15 for Cre+Lepr+/+ and n = 11 for Cre−Lepr+/+. Performed repeated measures two-way ANOVA with post-hoc analysis. #p < 0.05 vs. Cre−LeprloxTB/loxTB. Main effect of time (p < 0.05) in (A–C).

