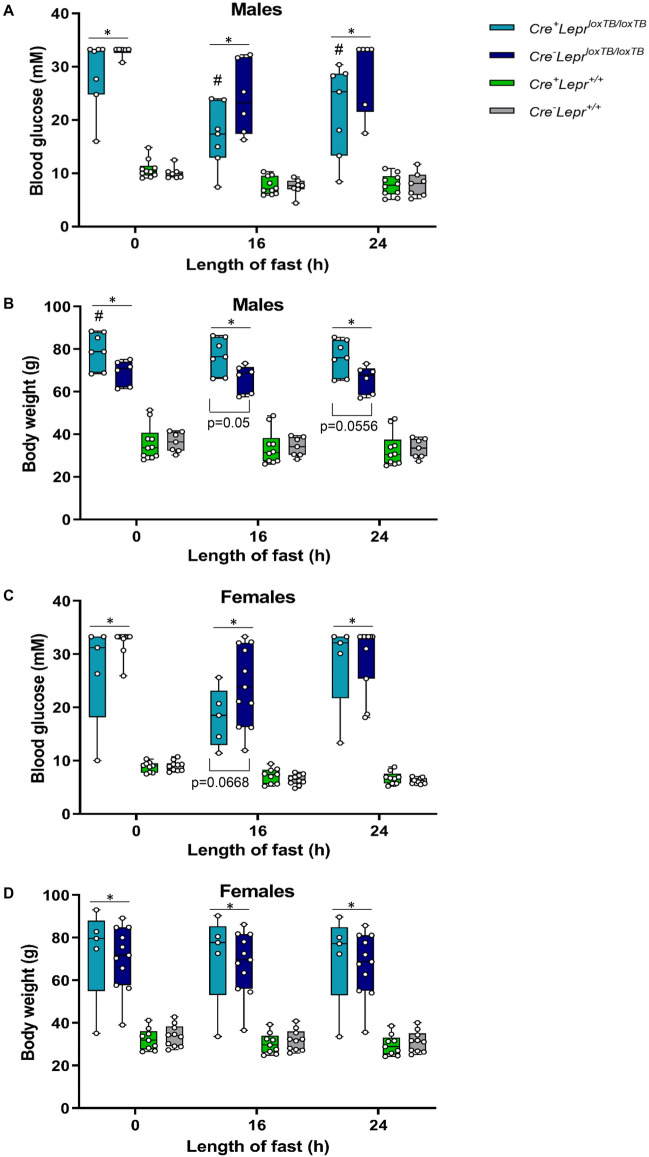
Figure 5.
Blood glucose concentration (A, C) and body weight (B, D) of mice from the Lepr reconstitution study at different fasting times. In (A) and (B), n = 7 for Cre+LeprloxTB/loxTB, n = 6 for Cre−LeprloxTB/loxTB, n = 10 for Cre+Lepr+/+, and n = 7 for Cre−Lepr+/+. In (C) and (D), n = 5 for Cre+LeprloxTB/loxTB, n = 11 for Cre−LeprloxTB/loxTB, n = 9 for Cre+Lepr+/+, and n = 10 for Cre−Lepr+/+. Performed repeated measures two-way ANOVA with post-hoc analysis. *p < 0.05, Cre+LeprloxTB/loxTB and Cre− LeprloxTB/loxTB vs. Cre+Lepr+/+ and Cre−Lepr+/+; #p < 0.05 vs. Cre−LeprloxTB/loxTB. Main effect of time (p < 0.05) in (A–D).

