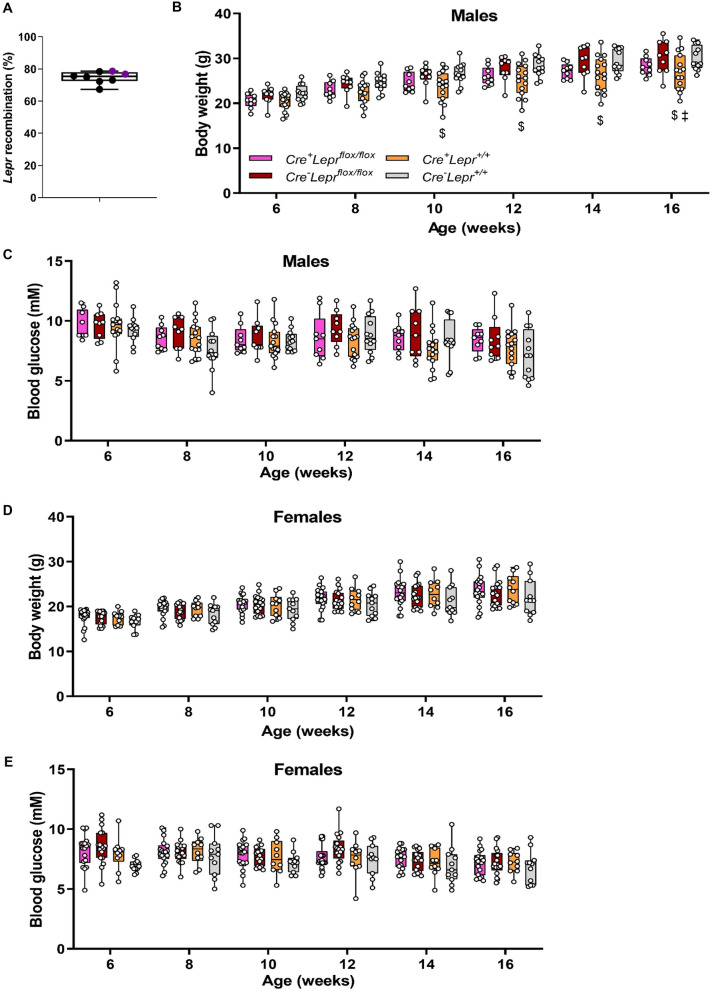
Figure 7.
Recombination in bone marrow-derived macrophages of mice from the Lepr knockdown study; male mice are represented by black circles and female mice are represented by purple circles (A). Body weight (B, D) and blood glucose (C, E) of mice from the Lepr knockdown study at different ages; parameters obtained after a 4 h fast. In (B) and (C), n = 9 for Cre+Leprflox/flox, n = 9 for Cre−Leprflox/flox, n = 15 for Cre+Lepr+/+, and n = 12 for Cre−Lepr+/+. In (D) and (E), n = 18 for Cre+Leprflox/flox, n = 17 for Cre−Leprflox/flox, n = 10 for Cre+Lepr+/+, and n = 11 for Cre−Lepr+/+. Performed repeated measures two-way ANOVA with post-hoc analysis in (B–E). $p < 0.05, Cre+Lepr+/+ vs. Cre−Lepr+/+; ‡p < 0.05, Cre−Leprflox/flox vs. Cre+Lepr+/+. Main effect of time (p < 0.05) in (B–E).

