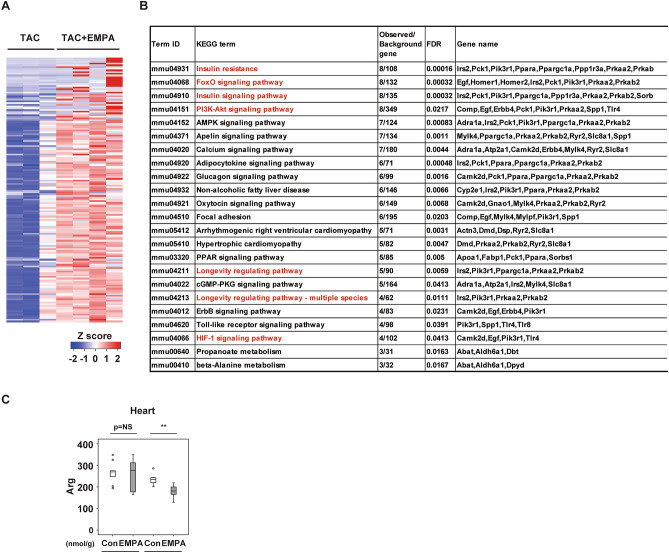
Figure 3.
Results of RNA seq studies analyzing LV with EMPA administration. (A,B) RNA seq analysis data for cardiac tissues: Heat map (A) or KEGG categories enriched by twofold (q < 0.05, Benjamini–Hochberg correction for multiple-testing) in mice with empagliflozin (EMPA) administration and TAC (TAC + EMPA) as compared with mice with TAC only (B; n = 3, 4). For this study, cardiac tissues were collected 5 days after the introduction of EMPA at TAC2w, and samples were collected at TAC2w + 5 days. (C) Metabolomic study analyzing arginine (Arg) in cardiac tissues of indicated mice (n = 10, 10, 8, 9). For study in (C), 1 outlier (in TAC + Con group) was excluded by boxplot (SPSS) for further statistical analysis (n = 10, 10, 7, 9 were analyzed). Data were analyzed by 2-way analysis of variance (ANOVA) followed by Dunnett’s test (C). *P < 0.05, **P < 0.01. Values are shown as the mean ± SEM. NS = not significant. Small circle indicates outlier, triangle indicates abnormal value. Analyses were performed with and without these values; when the results of both analyses were nonsignificant, the difference was described as NS.

