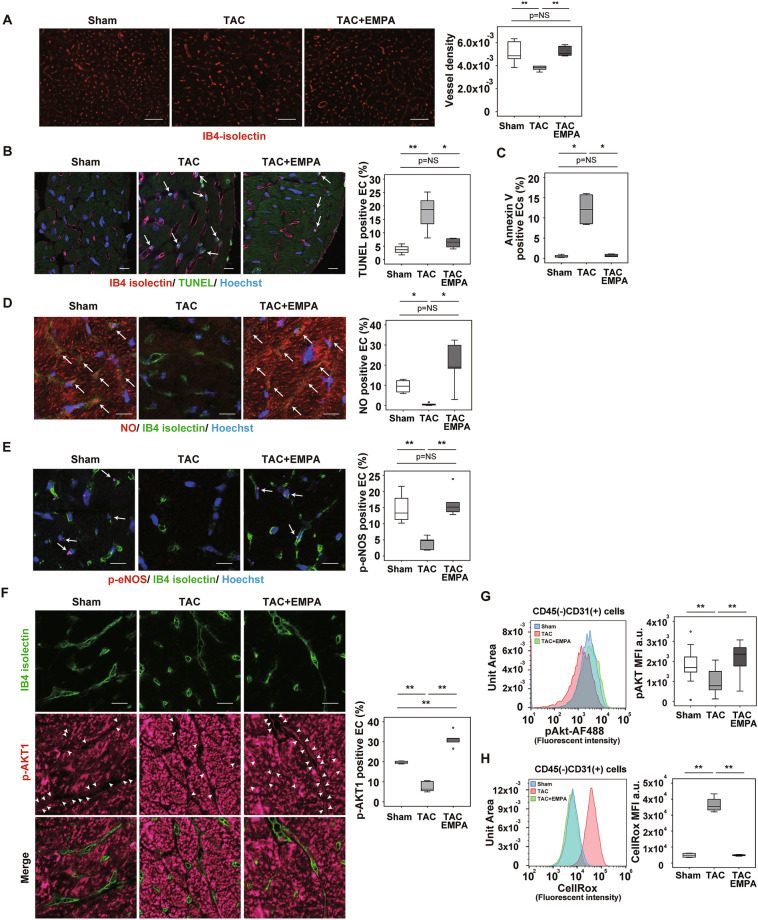
Figure 4.
EMPA enhances capillarization in LV during pressure overload. (A) Capillarization of left ventricle (LV) of indicated mice as analyzed with IB4-isolectin staining. Right panel indicates vessel density (n = 6, 5, 5). Scale bar = 50 μm. (B,D–F): IB4-isolectin staining co-stained with TUNEL and Hoechst (B; scale bar = 10 μm; arrow indicates TUNEL-positive endothelial cells [ECs]); NO and Hoechst (D; scale bar = 10 μm; arrow indicates NO-positive ECs); p-eNOS (E; scale bar = 10 μm; arrow indicates p-eNOS positive ECs); and p-AKT1 (F; scale bar = 10 μm; arrow head indicates p-AKT1–positive ECs). Right panels indicate quantification (B, n = 4, 4, 4; D, n = 4, 5, 5; E, n = 4, 5, 5; and F, n = 4, 5, 5). (C,G,H) Flow cytometry studies analyzing level of Annexin V (C) (n = 4, 4, 4), pAKT (G) (n = 14, 14, 14), and reactive oxygen species (CellRox) (H) (n = 4, 4, 4) in CD45-CD31+ ECs extracted from cardiac tissues of indicated mice. Data were analyzed by 2-way analysis of variance (ANOVA) followed by Tukey’s multiple comparison test (A,B,D–H), or Kruskal Wallis correction (C). *P < 0.05, **P < 0.01. Values are shown as the mean ± SEM. NS not significant. Small circle indicates outlier, triangle indicates abnormal value. Analyses were performed with and without these values; when the results of both analyses were nonsignificant, the difference was described as NS.

