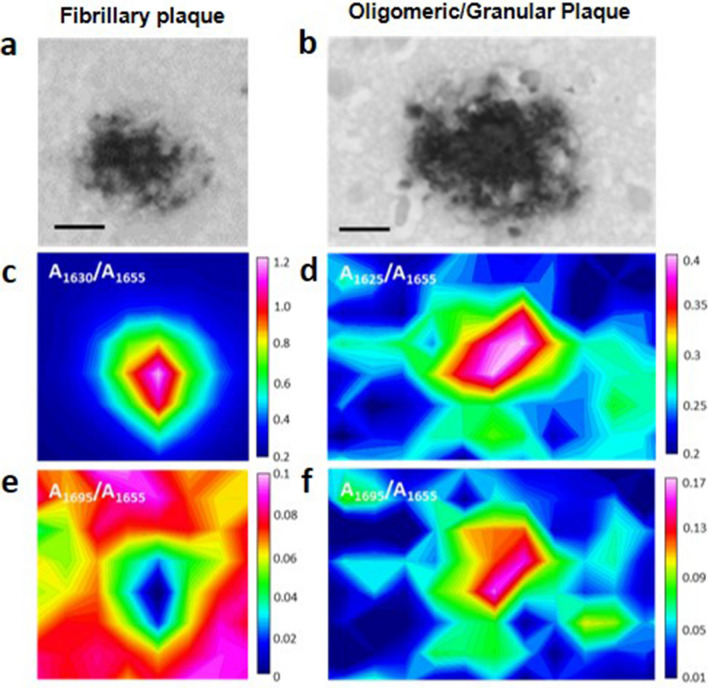
Figure 4.
Representative infrared and visible maps of a fibrillary plaque (left panels) and an Oligomeric/Granullar plaque (right panels). (Top row) Images in the visible region of the plaque labeled with an antiamyloid antibody in a contiguous brain slide; (Midle row) absorbance ratios corresponding to fibrillary β-sheet amyloid aggregation; (Bottom row) absorbance ratios corresponding to antiparallel β-sheet aggregation distribution. Ratios were calculated from the second derivative spectra. Scale bar = 10 μm. Opus 7.5 (Bruker) software was used for the maps representation.

