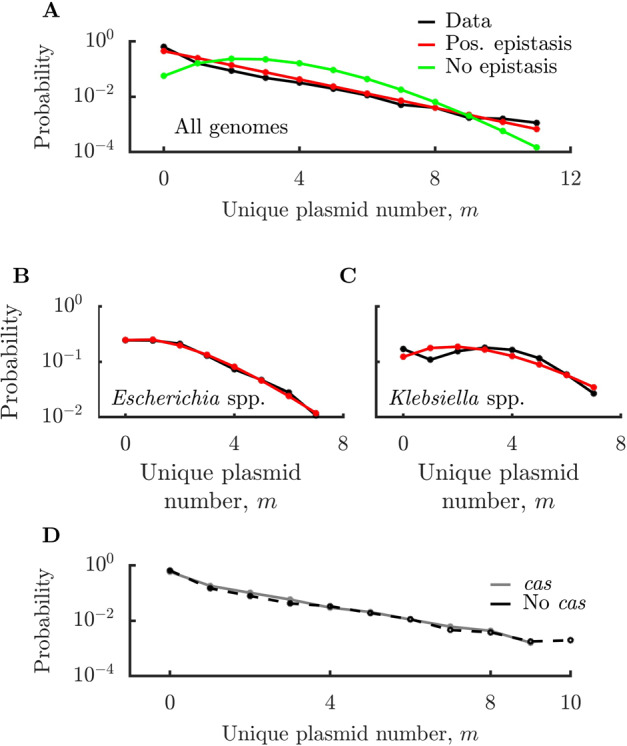
Fig. 3. Comparison of distributions of number of unique plasmid types per cell in natural genomes to Wright–Fisher model.

A Distribution of number of plasmid types per cell in 17,725 complete NCBI genomes. Positive epistasis distribution fit with the fitness function for (best-fit parameters: , ), no epistasis distribution fit with (best-fit parameters: , ). B Distribution of number of plasmid types per cell in 1153 complete Escherichia genomes, with a positive epistasis fit using the fitness function (best-fit parameters: , , ). C Distribution of number of plasmid types per cell in 576 complete Klebsiella genomes, with a positive epistasis fit using the fitness function as in (B) (best-fit parameters: , , ). Note that in certain limits of our models, only the ratio of and can be properly estimated, effectively reducing them to single parameter (see SI Appendix 3). D Distribution of number of plasmid types per cell in genomes containing and not containing cas genes. Genomes are considered cas containing if at least one chromosome or plasmid within the genome contains a cas gene. See “Methods” for details.
