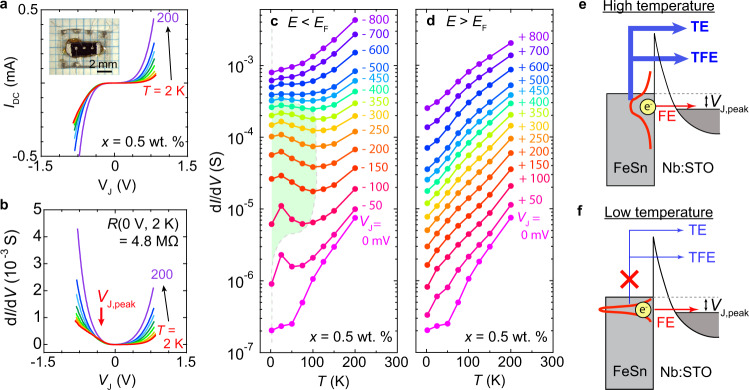
Fig. 2. Temperature-dependent tunneling in a x = 0.5 wt.% junction.
aI–V characteristics and b dI/dV spectra at different temperatures for the FeSn/Nb:STO junction with x = 0.5 wt. %. The measurements were taken at T = 2, 25, 50, 75, 100, 125, 150, 200 K. The inset in a is an optical micrograph of the measuring device. The red arrow in b marks VJ,peak, the position of the broad peak in dI/dV at low temperature. c, d Temperature-dependent dI/dV for negative and positive VJ for the x = 0.5 wt.% junction. The green-shaded area denotes the region in which dI/dV increases as temperature decreases. e, f Schematic of the tunneling mechanisms across the Schottky barrier. Non-resonant thermionic emission (TE) and thermionic field emission (TFE) processes dominate in the high-temperature regime, whereas resonant field emission (FE) process through the barrier dominates in the low-temperature regime.

