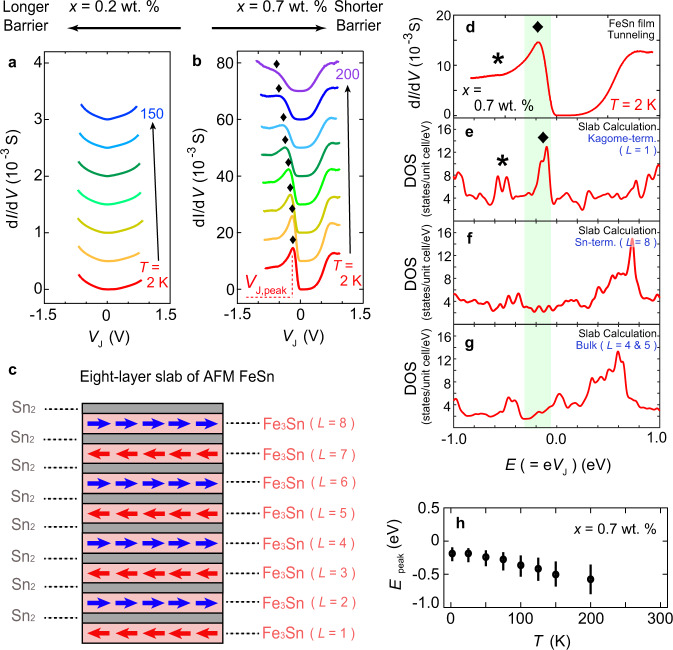
Fig. 3. Tunneling in x = 0.2, 0.7 wt.% junctions.
dI/dV spectra at different temperatures for FeSn/Nb:STO junctions with a x = 0.2 wt.% and b x = 0.7 wt.%. The measurements were taken at T = 2, 25, 50, 75, 100, 125, 150, 200 K. Each curve is offset vertically by an equal amount with respect to the T = 2 K trace for clarity. For the x = 0.7 wt.% junction in b, the positions of the peak in dI/dV are marked with diamonds. c Schematic of the eight-layer slab of antiferromagnetic FeSn. d dI/dV spectrum for the x = 0.7 wt.% junction at T = 2 K. Energy-dependent DOS spectra at e the kagome-terminated surface, f the Sn-terminated surface, and g the bulk of the eight-layer FeSn slab with the antiferromagnetic spin configuration. The green-shaded box across d–g denotes the energy window in which the peak feature in dI/dV was observed. Diamonds and asterisks mark the positions of noticeable features that correlate between d and e. h Temperature-dependent dI/dV peak positions (Epeak) (circles) and corresponding full widths at half maximum (FWHM) (vertical bar), extracted from b.

