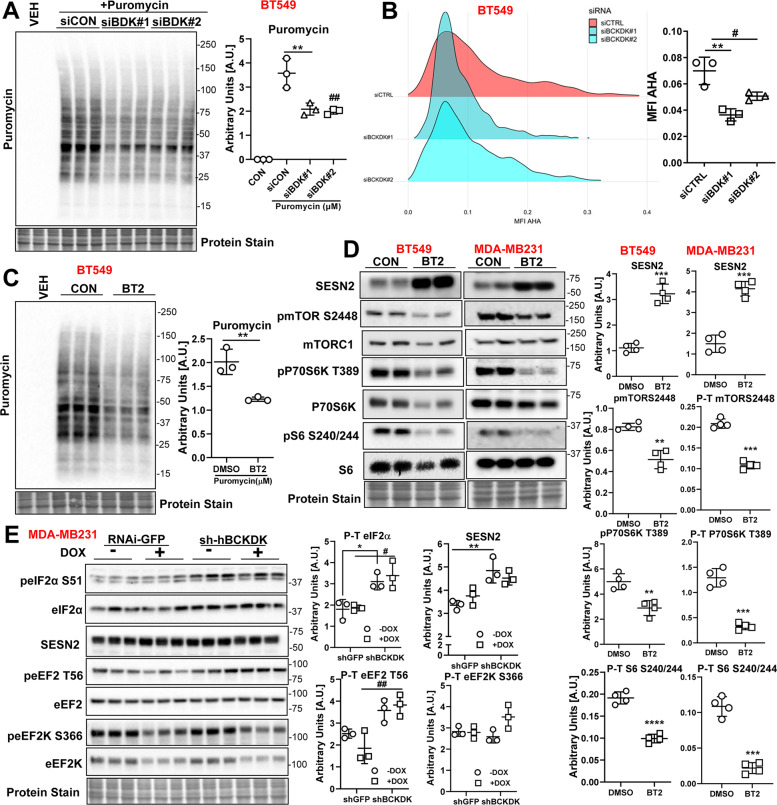
Fig. 6. BCKDK inhibition decreases protein synthesis and mTOR signaling in TNBCs.
A BT549 was transfected with siCON, siBDK#1, or siBDK#2 for 72 h followed by incubation with 1 μM puromycin for 30 min. Immunoblot and densitometric analysis of puromycin incorporation. B Fluorogram and quantification of AHA incorporation in BT549 cells transfected with siCON, siBDK#1, or siBDK#2. C Immunoblot and densitometric analysis of puromycin incorporation in BT549 cells treated with 500 µM BT2 for 20 h followed by incubation with 1 μM puromycin for 30 min. The graph represents mean ± S.D., n = 3, *p < 0.05 was performed using Student’s t test. D Immunoblot and densitometric analysis of SESN2, total and phosphorylated mTOR S2448, total and phosphorylated P70S6K T389, and total to phosphorylated S6 S240/244 in BT549 and MDA-MB231 cells treated with 500 µM BT2 for 20 h. Data presented as mean ± S.D. Statistical analysis was performed using Student’s t test; *p < 0.05, **p < 0.01, ****p < 0.0001 as indicated. Immunoblot and densitometric analysis of total and phosphorylated eIF2α S51, Sesn2, total and phosphorylated eEF2 T56, total and phosphorylated eEF2K S266, total and phosphorylated AKT S473, and AKT T308 in MDA-MB231 cells transduced with shGFP or shBCKDK for 48 h followed by 2 µM DOX or DMSO treatment for 18 h. Quantifications are from three independent experiments. A–B, *siCON vs siBDK#1, #siCON vs siBDK#2; E, *shGFP vs sh-hBCKDK, #shGFP+DOX vs sh-hBCKDK+DOX. Data presented as mean ± S.D. Statistical analysis was performed using a two-way ANOVA followed by a Tukey’s multiple comparison test; *p < 0.05, **p < 0.01, ****p < 0.0001 as indicated.

