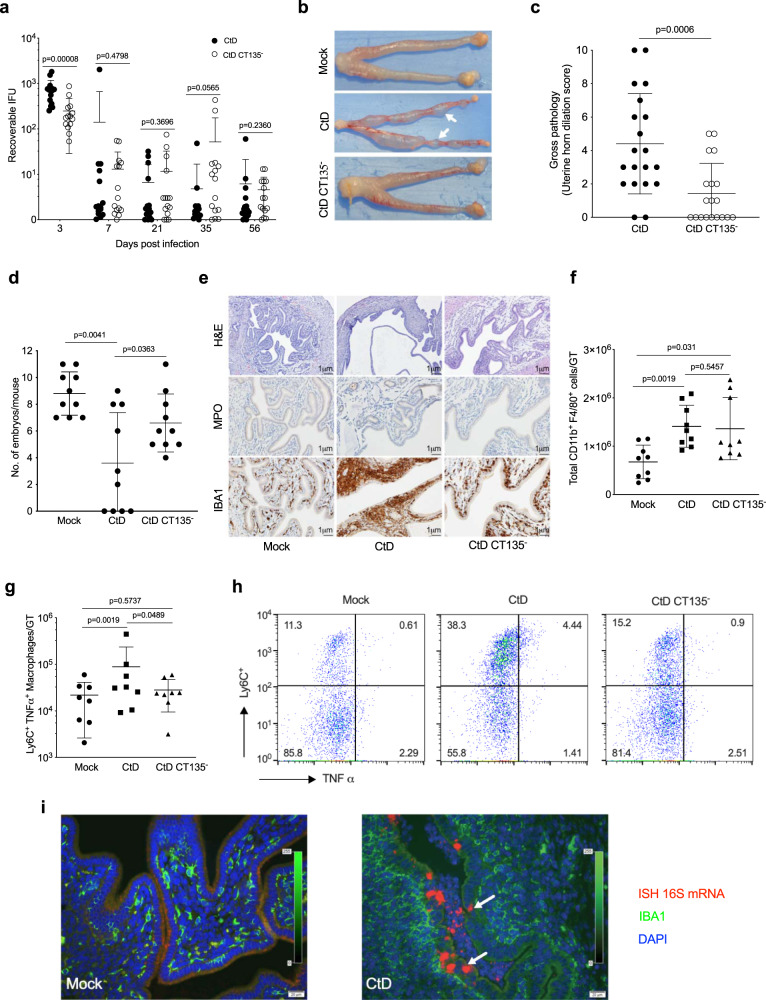
Fig. 1. Infection and genital tract pathology of CtD and CtD CT135- infected C57BL/6 female mice.
a Infection kinetics. CtD infected mice exhibit significantly higher burden at day 3 pi (n = 15 mice per chlamydial strain, two-tailed Mann–Whitney test). b Gross genital tract pathology at day 56 pi. White arrows denote uterine horn dilation with associated protrusions extending through the myometrium. c Quantification of gross uterine horn pathology. Clinical disease severity of CtD and CtD CT135- infected mice was scored (0–10) by counting the total number of protrusions on both uterine horns from individual mice. (n = 19 mice per chlamydial strain, two-tailed Mann–Whitney test). d Infertility of infected mice 6 weeks pi. (n = 10 mice per group, two-tailed Welch’s test). e Histopathology and immunohistochemistry. Histopathology in CtD infected mice at day 56 pi was characterized by severe endometrial gland dilation, stromal atrophy, and leukocyte infiltration comprised primarily of neutrophils and macrophages, whereas these histological changes in CtD CT135− infected mice were minimal to absent. IBA1 staining showed submucosal macrophage infiltration in CtD and CtD CT135− infected mice. f Flow cytometry of total CD11b+ F4/80+ macrophages in the whole GT of CtD and CtD CT135− infected mice at day 56 pi (n = 8 mice per bacterial strain, two-tailed Mann–Whitney test). g Flow cytometry of total CD11b+ F4/80+ Ly6C+ TNF-α+ macrophages in the whole GT of CtD and CtD CT135- infected mice at day56 pi (n = 8 mice per group, one-tailed student’s t test). h Flow cytometry CD11b+ F4/80+ Ly6C+ TNF-α+ macrophages of representative mice in panel (g). i Fluorescence immunohistochemical staining and in situ hybridization of chlamydial 16S mRNA at day 56 pi. Chlamydial 16S mRNA detection was found in uterine epithelial cells and luminal neutrophils in CtD infected mice (white arrows). Importantly, no chlamydial 16S mRNA was detected in IBA1-positive submucosal macrophages. a, c, d, f, g Data are pooled from two independent experiments and are shown as the mean ± SD. e, i Images are shown are representative of n = 3 mice per group.

