
Fig. 2.
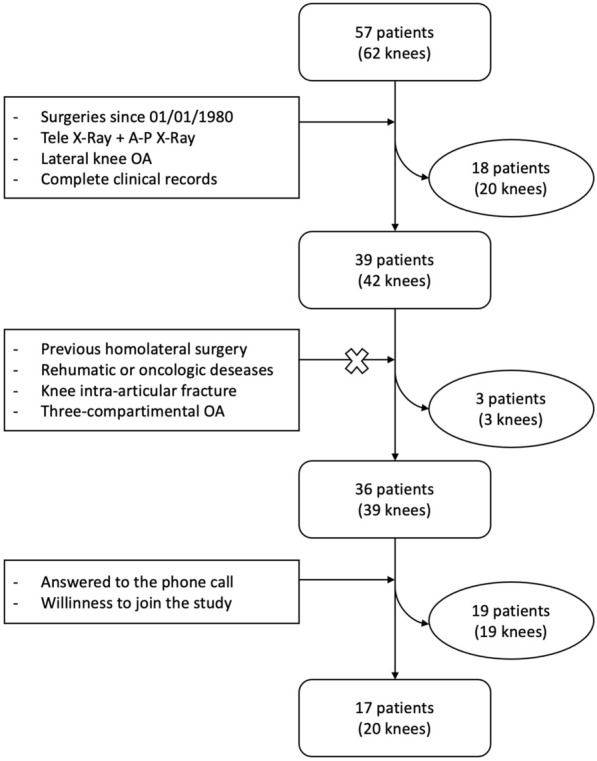
Flow chart of patient selection, from the initial group to the final subjects analyzed. Inclusion and exclusion criteria are shown in square boxes. The patients eliminated in each step are shown in the oval boxes
Official websites use .gov
A
.gov website belongs to an official
government organization in the United States.
Secure .gov websites use HTTPS
A lock (
) or https:// means you've safely
connected to the .gov website. Share sensitive
information only on official, secure websites.
Flow chart of patient selection, from the initial group to the final subjects analyzed. Inclusion and exclusion criteria are shown in square boxes. The patients eliminated in each step are shown in the oval boxes