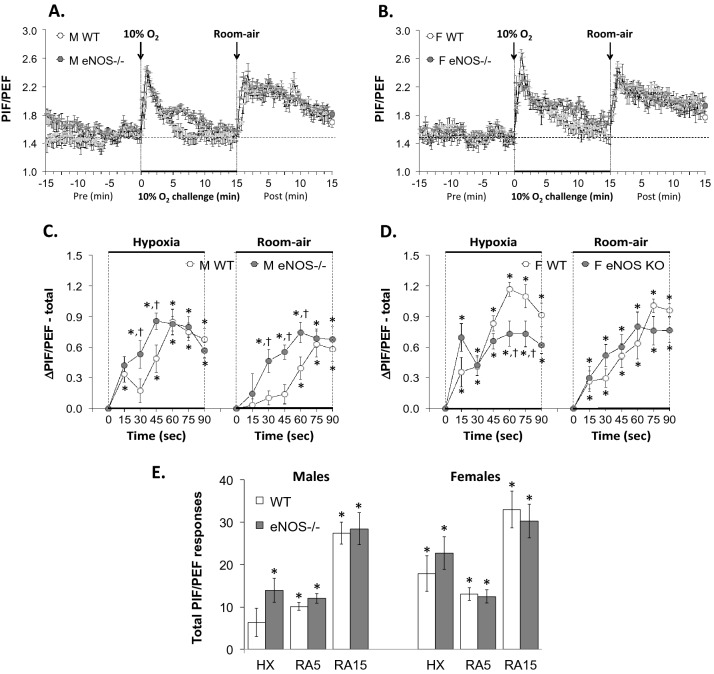
Figure 7.
Panels (A) and (B): Peak Inspiratory Flow/Peak Expiratory Flow (PIF/PEF) ratios before, during a hypoxic gas challenge (HXC, 10% O2, 90% N2), and upon return to room-air in male (M) and female (F) wild-type (WT) and eNOS knock-out (eNOS–/–) mice. Panels (C) and (D): Arithmetic changes in PIF/PEF ratios in WT and eNOS–/– male and female mice during the first 90 s of exposure to the HXC and the first 90 s upon return to room-air. Panel (E): Total changes in PIF/PEF ratios in WT and eNOS–/– male and female mice during HXC and during the first 5 min (RA5) and entire 15 min (RA15) return to room-air. Data are shown as mean ± SEM. The data were analyzed by one-way or two-way ANOVA followed by Student’s modified t-test with Bonferroni corrections for multiple comparisons between means using the error mean square terms from each ANOVA. *P < 0.05, significant response. †P < 0.05, eNOS–/– versus WT within each sex.

