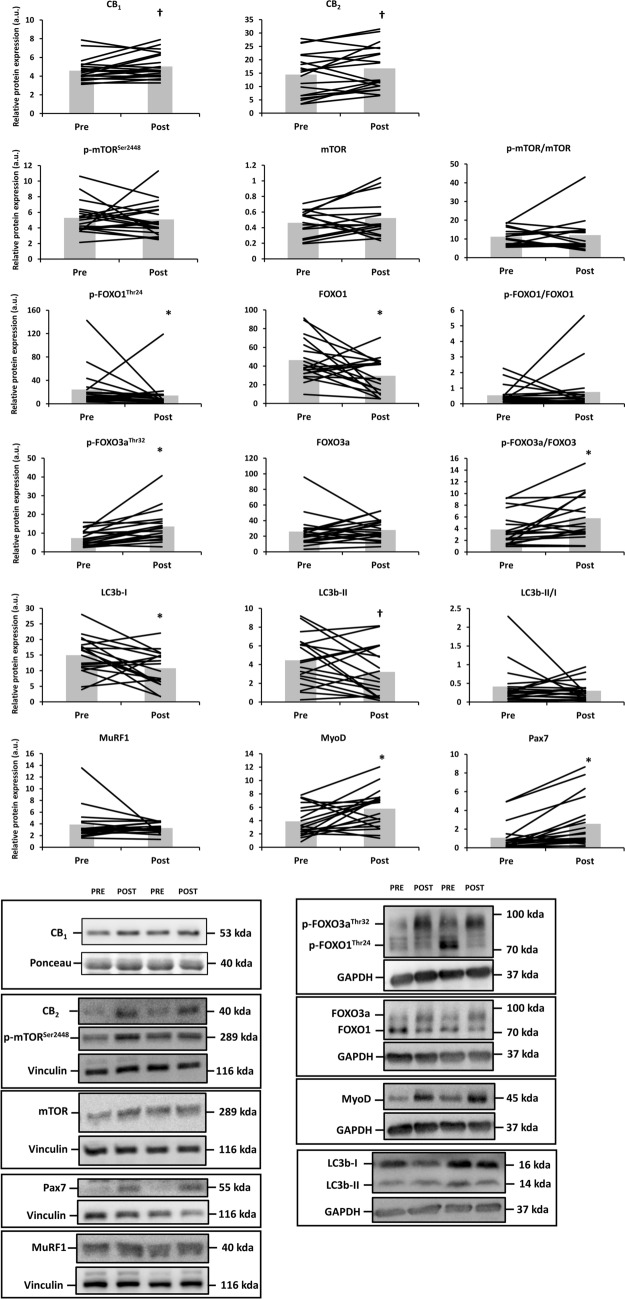
Figure 2.
Differences in the protein expression of cannabinoid receptor 1 (CB1), CB2, phospho and total mammalian target of rapamycin (mTOR) at Ser2448, phospho and total forkhead box O (FOXO)1/3a at Thr24/32, microtubule-associated protein 1A/1B-light chain 3 (LC3b), muscle RING finger-1 (MuRF1), MyoD and Pax7 before (Pre) and after (Post) resistance exercise in old adults (n = 19). Protein targets were normalized to glyceraldehyde 3-phosphate dehydrogenase (GAPDH), vinculin or the total protein form. Data are shown as mean (bar graph in grey) with individual data points (black lines superimposed on the bar graphs). *p < 0.05 and †p = 0.05–0.10 for Paired-Samples t Test or Wilcoxon signed-rank test. Raw western blot data of all replicates are displayed in Supplementary Figure 4. Ponceau red staining of the presented western blots are included in Supplementary Figure 5.

