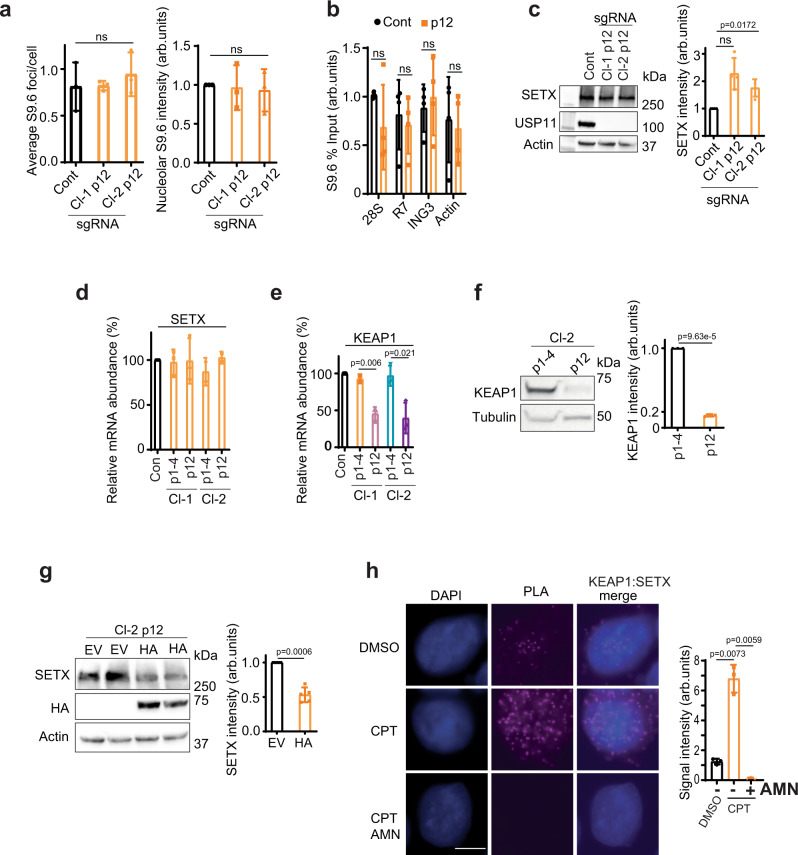
Fig. 5. Aged USP11-knockout cells restore SETX and R-loop levels via downregulation of KEAP1.
a Parental HEK-293 cells (Cont) and USP11-knockout clones 1 and 2 (Cl-1 and Cl-2) at passage 1–14 (p12) were examined for R-loop levels using S9.6/nucleolin immunostaining. The average number of S9.6 foci/cell (left panel) and total nucleolar fluorescence normalized to control cells (right panel) were calculated from three biological repeats, each containing at least 100 cells and presented as average ± SD. ns; p > 0.05, two-tailed Student’s t-test. b Lysates from Control (Cont) and USP11-knockout clone-2 at passage 12–15 (p12) were subjected to DNA/RNA immunoprecipitation (DRIP) using S9.6 antibodies. Quantitative PCR was conducted using primers targeting nucleolar (28S and R7) and nuclear (ING3 and actin) loci. The data represent the average ± SD from four biological repeats. Raw % input values are shown in Supplementary Fig. 5b. ns; p > 0.05, two-tailed Student’s t-test. c Lysates from parental HEK-293 cells (Cont) and USP11-knockout clones 1 and 2 (Cl-1 and Cl-2) at passage 12–14 (p12) were fractionated by SDS-PAGE and analysed by immunoblotting (left panel). SETX band intensities were normalized to actin and presented as fold increase compared to control cells (right panel). Data are the mean of four biological repeats ± SD. ns; p > 0.05, two-tailed Student’s t-test. d, e Total RNA was extracted from young (p1–4) and aged (p12–15; p12) USP11 sgRNA clones, reverse transcribed to cDNA and transcript levels of SETX and KEAP1 were quantified by qPCR. SETX and KEAP1 mRNA levels were first normalized to actin and then presented as % change compared to levels in control cells. Data are the mean ± SD from three biological repeats. p-Values calculated using two-tailed Student’s t-test. f Lysates from young (p1–4) and aged (p12–15, p12) USP11 sgRNA clone-2 (Cl-2) were fractionated by SDS-PAGE and analysed by immunoblotting (left panel). KEAP1 band intensities were normalized to tubulin and presented as fold decrease compared to p1–4 (right panel). Data are the mean of three biological repeats ± SD. p-Values calculated using two-tailed Student’s t-test. g Lysates from USP11-knockout clone-2 (Cl-2) at passage 12 were transfected with empty vector (EV) or HA-KEAP1 (HA) plasmids and fractionated by SDS-PAGE for immunoblotting analysis. Two biological repeats are shown (left panel). SETX band intensities were normalized to actin and presented as fold decrease compared to EV (right panel). Data are the mean of five biological repeats ± SD. p-Values calculated using two-tailed Student’s t-test. h MRC-5 cells treated with mock (DMSO) or α-amanitin (AMN) overnight followed by 10 min incubation with 25 µM CPT were subjected to proximity ligation assay using antibodies against endogenous KEAP1 and SETX. Representative images are shown, scale bar is equal to 10 µm (left panel). The signal intensity was measured using ImageJ (right panel). Data are the mean ± SD from three biological repeats. p-Values calculated using two-tailed Student’s t-test.

